Insights
Insights
Municipal Insights
Get insight into the highly fragmented, complex, and inefficient municipal bond market from the seasoned, active investors at MacKay Municipal Managers. Watch the latest videos and listen and subscribe to our Muni 360 podcast to hear the team’s in-depth conversations on all-things muni.

Navigating Tax & Public Policy for Today’s Municipal Market

Munis Find a Way to Balance Risks

Top 5 Muni Market Insights 2025: Mid-Year Update

Finding Value in a Shifting Muni Market

Municipal Bond Market Update: Key Performance Drivers

Consider MSTIX Amid Declining Money Market Yields

2025 Municipal Market Outlook

2024 Municipal Bond Market Insights: Mid-year Update

Opportunities in Active Municipal Bond Fund Management

The MacKay Municipal Managers Difference

Investment Insights: Power of Tax Equivalent Yield

Investment Idea: Attractive Alternatives to T-Bills

Morningstar Magazine: Complementing the Core
Investment Insights: T-Bill Yields Are Projected to Decline

A Golden Opportunity - California Municipal Bonds

Keep More of What You Earn with Municipal Bonds

Five Tax Tips for Investors

Investing Essentials: The Power of Taxable Equivalent Yield (National)
Muni 360
Muni 360
Muni 360
Podcast: Listen and Subscribe
Listen to in-depth conversations, as the seasoned, active investors at MacKay Municipal Managers share their latest views on the municipal market.

Subscribe to get the latest Muni 360 Podcast episode delivered to your inbox.
By subscribing you are consenting to receive personalized online advertisements from New York Life Investments.
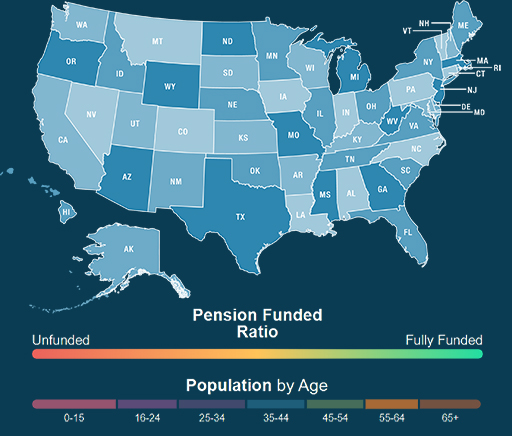
State by State Breakdown
Use this interactive tool for key statistics that summarize each state's municipal profile.
Muni 360 Report
Get a comprehensive view into the municipal market alongside insights from MacKay Municipal Managers.
MacKay Municipal Managers
MacKay Municipal Managers
MacKay Municipal Managers
MacKay Municipal Managers™
The Minds Behind Munis
The experience of a large firm. The approach of a nimble, autonomous boutique. Plus, fund managers with a personal touch and a track record of success. All of which means we have the insights, experience and solutions you need to help take advantage of the municipal bond market. A recognized leader in active municipal bond investing, the team at MacKay Municipal Managers averages over 20 years of industry experience, and its Co-CIOs have worked together since 1993.

John Loffredo, CFA
Vice Chairman

Robert DiMella, CFA
Executive Managing Director
Asset Allocation Guides
Asset Allocation Guides
Municipal Bond Asset Allocation Guides
For Advisors Only
MacKay Municipal Managers provides its municipal bond asset allocation portfolios for investors seeking to construct blended exposures. For Financial Advisors looking to build their clients’ portfolios, download our Municipal Bond Asset Allocation Guide.
Investors, please inquire about our guide with your financial advisor.
Download State-Specific Asset Allocation Guides:
The Asset Allocation Guides provide financial advisors and their clients with a framework that incorporates the related concepts of investor objectives and relative risk. This should be viewed in the context of a starting point in the conversation that takes place between the advisor and the client.
What’s Your Risk Tolerance?
Download the guides for more details, including suggested allocations for Conservative, Moderate and Aggressive investors.
Solutions
Solutions
Explore Our Highly Rated Muni Solutions
Our Municipal Suite of Solutions
- at NAV
- W/ sales charge (MF)/mkt price (ETF)
| Morningstar Rating Risk Adjusted Returns As of 03/31/2026 | Average Annual Total Returns As of 03/31/2026 As of 03/31/2026 | ||||||||||||
|---|---|---|---|---|---|---|---|---|---|---|---|---|---|
| Symbol | Name | Asset Class | Share Class | Overall Rating | Category | Funds in Category | YTD | 1Y | 3Y | 5Y | 10Y | SI | Incept. Date |
| MTFCX | NYLI MacKay Tax Free Bond Fund | Fixed Income | C |
|
Muni National Long | 152 | 1.04 1.04 0.04 0.04 | 4.19 4.19 3.19 3.19 | 2.65 2.65 2.65 2.65 | 0.23 0.23 0.23 0.23 | 1.90 1.90 1.90 1.90 | 3.17 3.17 3.17 3.17 | 09/01/1998 |
| MTBAX | NYLI MacKay Tax Free Bond Fund | Fixed Income | A |
|
Muni National Long | 152 | 1.12 1.12 -1.91 -1.91 | 4.50 4.50 1.36 1.36 | 2.95 2.95 1.91 1.91 | 0.51 0.51 -0.41 -0.41 | 2.17 2.17 1.70 1.70 | 4.04 4.04 3.89 3.89 | 01/03/1995 |
| MKINX | NYLI MacKay Tax Free Bond Fund | Fixed Income | IN |
|
Muni National Long | 152 | 1.10 1.10 -1.42 -1.42 | 4.42 4.42 1.81 1.81 | 2.89 2.89 2.03 2.03 | 0.47 0.47 -0.34 -0.34 | 2.15 2.15 1.68 1.68 | 3.68 3.68 3.41 3.41 | 02/28/2008 |
| MTSPX | NYLI MacKay Tax Free Bond Fund | Fixed Income | C2 |
|
Muni National Long | 152 | 0.99 0.99 -0.01 -0.01 | 4.03 4.03 3.03 3.03 | 2.46 2.46 2.46 2.46 | 0.07 0.07 0.07 0.07 | - - - - | 0.41 0.41 0.41 0.41 | 08/31/2020 |
| MTBIX | NYLI MacKay Tax Free Bond Fund | Fixed Income | I |
|
Muni National Long | 152 | 1.20 1.20 - - | 4.75 4.75 - - | 3.20 3.20 - - | 0.76 0.76 - - | 2.42 2.42 - - | 3.88 3.88 - - | 12/21/2009 |
| MTBDX | NYLI MacKay Tax Free Bond Fund | Fixed Income | R6 |
|
Muni National Long | 152 | 1.21 1.21 - - | 4.81 4.81 - - | 3.22 3.22 - - | 0.80 0.80 - - | - - - - | 1.68 1.68 - - | 11/01/2019 |
| MEGI | NYLI CBRE Global Infrastructure Megatrends Term Fund | Equities | - | - | Infrastructure | 82 | 14.46 14.46 13.49 13.49 | 23.96 23.96 22.48 22.48 | 9.23 9.23 12.85 12.85 | - - - - | - - - - | 4.40 4.40 2.84 2.84 | 10/27/2021 |
| MECFX | NYLI Epoch Capital Growth Fund | Equities | I |
|
Global Large-Stock Growth | 299 | 3.34 3.34 - - | 13.66 13.66 - - | 13.14 13.14 - - | 9.16 9.16 - - | - - - - | 12.90 12.90 - - | 06/30/2016 |
| MECEX | NYLI Epoch Capital Growth Fund | Equities | C |
|
Global Large-Stock Growth | 299 | 2.96 2.96 1.96 1.96 | 12.22 12.22 11.22 11.22 | 11.72 11.72 11.72 11.72 | 7.78 7.78 7.78 7.78 | - - - - | 11.53 11.53 11.53 11.53 | 06/30/2016 |
| MECVX | NYLI Epoch Capital Growth Fund | Equities | IN |
|
Global Large-Stock Growth | 299 | 3.19 3.19 -1.97 -1.97 | 13.01 13.01 7.35 7.35 | 12.55 12.55 10.64 10.64 | 8.59 8.59 7.48 7.48 | - - - - | 12.36 12.36 11.71 11.71 | 06/30/2016 |
| MECDX | NYLI Epoch Capital Growth Fund | Equities | A |
|
Global Large-Stock Growth | 299 | 3.22 3.22 -2.45 -2.45 | 13.31 13.31 7.07 7.07 | 12.83 12.83 10.72 10.72 | 8.88 8.88 7.65 7.65 | - - - - | 12.62 12.62 11.97 11.97 | 06/30/2016 |
| IQSU | NYLI Candriam U.S. Large Cap Equity ETF | Equities | - |
|
Large Blend | 1212 | 0.63 0.63 0.49 0.49 | 14.38 14.38 14.36 14.36 | 14.57 14.57 14.56 14.56 | 10.05 10.05 10.03 10.03 | - - - - | 13.35 13.35 13.34 13.34 | 12/17/2019 |
| MLINX | NYLI Winslow Large Cap Growth Fund | Equities | IN |
|
Large Growth | 998 | -4.15 -4.15 -8.94 -8.94 | 9.15 9.15 3.69 3.69 | 18.37 18.37 16.36 16.36 | 9.22 9.22 8.10 8.10 | 14.93 14.93 14.28 14.28 | 11.52 11.52 11.17 11.17 | 02/28/2008 |
| MLGRX | NYLI Winslow Large Cap Growth Fund | Equities | R3 |
|
Large Growth | 998 | -4.17 -4.17 - - | 8.94 8.94 - - | 18.16 18.16 - - | 9.02 9.02 - - | 14.68 14.68 - - | 10.98 10.98 - - | 04/28/2006 |
| MLRTX | NYLI Winslow Large Cap Growth Fund | Equities | R2 |
|
Large Growth | 998 | -3.99 -3.99 - - | 9.20 9.20 - - | 18.47 18.47 - - | 9.30 9.30 - - | 14.98 14.98 - - | 11.57 11.57 - - | 04/01/2005 |
| MLRRX | NYLI Winslow Large Cap Growth Fund | Equities | R1 |
|
Large Growth | 998 | -4.01 -4.01 - - | 9.48 9.48 - - | 18.72 18.72 - - | 9.55 9.55 - - | 15.25 15.25 - - | 11.84 11.84 - - | 04/01/2005 |
| MLAIX | NYLI Winslow Large Cap Growth Fund | Equities | I |
|
Large Growth | 998 | -4.02 -4.02 - - | 9.56 9.56 - - | 18.87 18.87 - - | 9.67 9.67 - - | 15.38 15.38 - - | 11.97 11.97 - - | 04/01/2005 |
| MLACX | NYLI Winslow Large Cap Growth Fund | Equities | C |
|
Large Growth | 998 | -4.36 -4.36 -5.32 -5.32 | 8.13 8.13 7.52 7.52 | 17.46 17.46 17.46 17.46 | 8.36 8.36 8.36 8.36 | 14.05 14.05 14.05 14.05 | 10.67 10.67 10.67 10.67 | 04/01/2005 |
| MLAAX | NYLI Winslow Large Cap Growth Fund | Equities | A |
|
Large Growth | 998 | -3.98 -3.98 -9.26 -9.26 | 9.20 9.20 3.19 3.19 | 18.53 18.53 16.32 16.32 | 9.39 9.39 8.16 8.16 | 15.08 15.08 14.43 14.43 | 10.01 10.01 9.81 9.81 | 07/01/1995 |
| MLRMX | NYLI Winslow Large Cap Growth Fund | Equities | SI |
|
Large Growth | 998 | -4.10 -4.10 - - | 9.00 9.00 - - | 18.30 18.30 - - | 9.05 9.05 - - | - - - - | 8.95 8.95 - - | 08/31/2020 |
| MLRSX | NYLI Winslow Large Cap Growth Fund | Equities | R6 |
|
Large Growth | 998 | -4.00 -4.00 - - | 9.54 9.54 - - | 18.95 18.95 - - | 9.75 9.75 - - | 15.47 15.47 - - | 14.54 14.54 - - | 06/17/2013 |
| FCIHX | NYLI PineStone International Equity Fund | Equities | P | - | Foreign Large Growth | 359 | 0.22 0.22 - - | 3.21 3.21 - - | - - - - | - - - - | - - - - | 6.10 6.10 - - | 08/28/2023 |
| FCIWX | NYLI PineStone International Equity Fund | Equities | R6 |
|
Foreign Large Growth | 359 | 0.22 0.22 - - | 3.26 3.26 - - | 5.50 5.50 - - | 4.34 4.34 - - | - - - - | 7.37 7.37 - - | 09/29/2017 |
| FCIKX | NYLI PineStone International Equity Fund | Equities | IN | - | Foreign Large Growth | 359 | 0.06 0.06 -4.95 -4.95 | 2.56 2.56 -2.57 -2.57 | - - - - | - - - - | - - - - | 5.40 5.40 3.34 3.34 | 08/28/2023 |
| FCIUX | NYLI PineStone International Equity Fund | Equities | I |
|
Foreign Large Growth | 359 | 0.22 0.22 - - | 3.17 3.17 - - | 5.42 5.42 - - | 4.20 4.20 - - | - - - - | 7.20 7.20 - - | 09/29/2017 |
| FCICX | NYLI PineStone International Equity Fund | Equities | C | - | Foreign Large Growth | 359 | -0.17 -0.17 -1.17 -1.17 | 1.73 1.73 0.73 0.73 | - - - - | - - - - | - - - - | 4.60 4.60 4.60 4.60 | 08/28/2023 |
| FCIRX | NYLI PineStone International Equity Fund | Equities | A |
|
Foreign Large Growth | 359 | 0.17 0.17 -5.34 -5.34 | 2.90 2.90 -2.76 -2.76 | 5.13 5.13 5.13 5.13 | 3.92 3.92 3.92 3.92 | - - - - | 6.96 6.96 6.96 6.96 | 09/29/2017 |
| CPLB | NYLI MacKay Core Plus Bond ETF | Fixed Income | - |
|
Intermediate Core-Plus Bond | 496 | 1.11 1.11 0.93 0.93 | 4.73 4.73 4.94 4.94 | 5.19 5.19 5.32 5.32 | - - - - | - - - - | 0.69 0.69 0.73 0.73 | 06/29/2021 |
| FCGPX | NYLI PineStone Global Equity Fund | Equities | P | - | Global Large-Stock Growth | 299 | 1.51 1.51 - - | 12.39 12.39 - - | - - - - | - - - - | - - - - | 10.37 10.37 - - | 08/28/2023 |
| FCGMX | NYLI PineStone Global Equity Fund | Equities | R6 | - | Global Large-Stock Growth | 299 | 1.56 1.56 - - | 12.36 12.36 - - | - - - - | - - - - | - - - - | 10.36 10.36 - - | 08/28/2023 |
| FCGIX | NYLI PineStone Global Equity Fund | Equities | I |
|
Global Large-Stock Growth | 299 | 1.56 1.56 - - | 12.37 12.37 - - | 10.23 10.23 - - | 7.75 7.75 - - | - - - - | 11.47 11.47 - - | 04/28/2017 |
| FCGYX | NYLI PineStone Global Equity Fund | Equities | C | - | Global Large-Stock Growth | 299 | 1.20 1.20 0.20 0.20 | 11.09 11.09 10.09 10.09 | - - - - | - - - - | - - - - | 9.10 9.10 9.10 9.10 | 08/28/2023 |
| FCGEX | NYLI PineStone Global Equity Fund | Equities | A |
|
Global Large-Stock Growth | 299 | 1.42 1.42 -4.16 -4.16 | 12.07 12.07 5.90 5.90 | 9.93 9.93 9.93 9.93 | 7.48 7.48 7.48 7.48 | - - - - | 11.18 11.18 11.18 11.18 | 04/28/2017 |
| IQHI | NYLI MacKay High Income ETF | Fixed Income | - |
|
High Yield Bond | 581 | 1.40 1.40 1.32 1.32 | 7.17 7.17 7.24 7.24 | 7.96 7.96 7.79 7.79 | - - - - | - - - - | 8.82 8.82 8.85 8.85 | 10/25/2022 |
| MTFHX | NYLI MacKay Strategic Muni Allocation Fund | Fixed Income | R6 |
|
Muni National Intermediate | 255 | 0.93 0.93 - - | 4.87 4.87 - - | 3.74 3.74 - - | 1.68 1.68 - - | - - - - | 2.37 2.37 - - | 06/28/2019 |
| MTFGX | NYLI MacKay Strategic Muni Allocation Fund | Fixed Income | I |
|
Muni National Intermediate | 255 | 1.03 1.03 - - | 4.94 4.94 - - | 3.74 3.74 - - | 1.66 1.66 - - | - - - - | 2.36 2.36 - - | 06/28/2019 |
| MTFFX | NYLI MacKay Strategic Muni Allocation Fund | Fixed Income | C |
|
Muni National Intermediate | 255 | 0.77 0.77 -0.23 -0.23 | 4.26 4.26 3.26 3.26 | 3.13 3.13 3.13 3.13 | 1.02 1.02 1.02 1.02 | - - - - | 1.71 1.71 1.71 1.71 | 06/28/2019 |
| MTFEX | NYLI MacKay Strategic Muni Allocation Fund | Fixed Income | IN |
|
Muni National Intermediate | 255 | 0.95 0.95 -1.58 -1.58 | 4.63 4.63 2.02 2.02 | 3.42 3.42 2.55 2.55 | 1.29 1.29 0.47 0.47 | - - - - | 1.99 1.99 1.29 1.29 | 06/28/2019 |
| MTFDX | NYLI MacKay Strategic Muni Allocation Fund | Fixed Income | A |
|
Muni National Intermediate | 255 | 0.85 0.85 -2.18 -2.18 | 4.56 4.56 1.43 1.43 | 3.47 3.47 2.43 2.43 | 1.41 1.41 0.48 0.48 | - - - - | 2.12 2.12 1.43 1.43 | 06/28/2019 |
| MTFZX | NYLI MacKay Strategic Muni Allocation Fund | Fixed Income | Z | - | Muni National Intermediate | 255 | 0.98 0.98 -2.05 -2.05 | 4.67 4.67 1.53 1.53 | - - - - | - - - - | - - - - | 3.23 3.23 1.40 1.40 | 07/22/2024 |
| MTFMX | NYLI MacKay Strategic Muni Allocation Fund | Fixed Income | C2 |
|
Muni National Intermediate | 255 | 0.83 0.83 -0.17 -0.17 | 4.22 4.22 3.22 3.22 | 3.01 3.01 3.01 3.01 | - - - - | - - - - | 3.15 3.15 3.15 3.15 | 12/13/2022 |
| IQSM | NYLI Candriam U.S. Mid Cap Equity ETF | Equities | - |
|
Mid-Cap Blend | 365 | 6.01 6.01 6.09 6.09 | 15.10 15.10 15.03 15.03 | 9.94 9.94 9.93 9.93 | - - - - | - - - - | 11.15 11.15 11.14 11.14 | 10/25/2022 |
| MCTRX | NYLI Income Builder Fund | Multi-Asset | C |
|
Global Moderate Allocation | 408 | 6.38 6.38 5.38 5.38 | 15.59 15.59 14.59 14.59 | 11.57 11.57 11.57 11.57 | 5.21 5.21 5.21 5.21 | 5.96 5.96 5.96 5.96 | 4.86 4.86 4.86 4.86 | 09/01/1998 |
| MTRAX | NYLI Income Builder Fund | Multi-Asset | A |
|
Global Moderate Allocation | 408 | 6.67 6.67 3.47 3.47 | 16.75 16.75 13.25 13.25 | 12.71 12.71 11.57 11.57 | 6.25 6.25 5.60 5.60 | 6.95 6.95 6.35 6.35 | 7.01 7.01 6.82 6.82 | 01/03/1995 |
| MTINX | NYLI Income Builder Fund | Multi-Asset | IN |
|
Global Moderate Allocation | 408 | 6.59 6.59 3.93 3.93 | 16.43 16.43 13.52 13.52 | 12.41 12.41 11.47 11.47 | 6.00 6.00 5.46 5.46 | 6.75 6.75 6.15 6.15 | 6.32 6.32 5.99 5.99 | 02/28/2008 |
| MTOIX | NYLI Income Builder Fund | Multi-Asset | I |
|
Global Moderate Allocation | 408 | 6.74 6.74 - - | 17.08 17.08 - - | 12.99 12.99 - - | 6.51 6.51 - - | 7.22 7.22 - - | 6.72 6.72 - - | 01/02/2004 |
| MTISX | NYLI Income Builder Fund | Multi-Asset | SI |
|
Global Moderate Allocation | 408 | 6.57 6.57 - - | 16.40 16.40 - - | 12.42 12.42 - - | 5.91 5.91 - - | - - - - | 6.95 6.95 - - | 08/31/2020 |
| MTODX | NYLI Income Builder Fund | Multi-Asset | R6 |
|
Global Moderate Allocation | 408 | 6.76 6.76 - - | 17.16 17.16 - - | 13.08 13.08 - - | 6.61 6.61 - - | - - - - | 7.18 7.18 - - | 02/28/2018 |
| IQSI | NYLI Candriam International Equity ETF | Equities | - |
|
Foreign Large Blend | 655 | 7.08 7.08 7.71 7.71 | 18.51 18.51 20.22 20.22 | 12.27 12.27 13.02 13.02 | 7.05 7.05 7.46 7.46 | - - - - | 7.98 7.98 8.33 8.33 | 12/17/2019 |
| MMRIX | NYLI Moderate Allocation Fund | Multi-Asset | I |
|
Global Moderate Allocation | 408 | 3.14 3.14 - - | 11.64 11.64 - - | 9.39 9.39 - - | 5.02 5.02 - - | 6.99 6.99 - - | 6.50 6.50 - - | 04/04/2005 |
| MMRCX | NYLI Moderate Allocation Fund | Multi-Asset | C |
|
Global Moderate Allocation | 408 | 2.84 2.84 1.84 1.84 | 10.32 10.32 9.32 9.32 | 8.09 8.09 8.09 8.09 | 3.75 3.75 3.75 3.75 | 5.72 5.72 5.72 5.72 | 5.28 5.28 5.28 5.28 | 04/04/2005 |
| MMRAX | NYLI Moderate Allocation Fund | Multi-Asset | A |
|
Global Moderate Allocation | 408 | 3.17 3.17 0.07 0.07 | 11.32 11.32 7.98 7.98 | 9.09 9.09 7.99 7.99 | 4.74 4.74 4.10 4.10 | 6.72 6.72 6.12 6.12 | 6.22 6.22 5.94 5.94 | 04/04/2005 |
| MMRDX | NYLI Moderate Allocation Fund | Multi-Asset | IN |
|
Global Moderate Allocation | 408 | 3.01 3.01 0.44 0.44 | 11.08 11.08 8.31 8.31 | 8.89 8.89 7.97 7.97 | 4.54 4.54 4.01 4.01 | 6.52 6.52 5.92 5.92 | 5.82 5.82 5.49 5.49 | 02/28/2008 |
| MMRSX | NYLI Moderate Allocation Fund | Multi-Asset | SI |
|
Global Moderate Allocation | 408 | 3.09 3.09 - - | 11.02 11.02 - - | 8.82 8.82 - - | 4.39 4.39 - - | - - - - | 5.66 5.66 - - | 08/31/2020 |
| MWFQX | NYLI Equity ETF Allocation Fund | Multi-Asset | R3 |
|
Global Aggressive Allocation | 133 | 5.15 5.15 - - | 19.21 19.21 - - | 13.93 13.93 - - | 7.21 7.21 - - | - - - - | 11.41 11.41 - - | 06/30/2020 |
| MWFIX | NYLI Equity ETF Allocation Fund | Multi-Asset | I |
|
Global Aggressive Allocation | 133 | 5.39 5.39 - - | 19.95 19.95 - - | 14.63 14.63 - - | 7.86 7.86 - - | - - - - | 12.07 12.07 - - | 06/30/2020 |
| MWFCX | NYLI Equity ETF Allocation Fund | Multi-Asset | C |
|
Global Aggressive Allocation | 133 | 5.03 5.03 4.03 4.03 | 18.71 18.71 17.71 17.71 | 13.47 13.47 13.47 13.47 | 6.76 6.76 6.76 6.76 | - - - - | 10.94 10.94 10.94 10.94 | 06/30/2020 |
| MWFVX | NYLI Equity ETF Allocation Fund | Multi-Asset | SI |
|
Global Aggressive Allocation | 133 | 5.21 5.21 - - | 19.35 19.35 - - | 14.03 14.03 - - | 7.29 7.29 - - | - - - - | 9.82 9.82 - - | 08/31/2020 |
| MWFAX | NYLI Equity ETF Allocation Fund | Multi-Asset | A |
|
Global Aggressive Allocation | 133 | 5.25 5.25 2.09 2.09 | 19.66 19.66 16.07 16.07 | 14.33 14.33 13.17 13.17 | 7.58 7.58 6.93 6.93 | - - - - | 11.79 11.79 11.20 11.20 | 06/30/2020 |
| MMHIX | NYLI MacKay High Yield Muni Bond Fund | Fixed Income | I |
|
High Yield Muni | 170 | 1.56 1.56 - - | 3.97 3.97 - - | 4.74 4.74 - - | 1.26 1.26 - - | 3.41 3.41 - - | 5.43 5.43 - - | 03/31/2010 |
| MMHDX | NYLI MacKay High Yield Muni Bond Fund | Fixed Income | C |
|
High Yield Muni | 170 | 1.35 1.35 0.35 0.35 | 2.93 2.93 1.93 1.93 | 3.69 3.69 3.69 3.69 | 0.25 0.25 0.25 0.25 | 2.37 2.37 2.37 2.37 | 4.37 4.37 4.37 4.37 | 03/31/2010 |
| MMHAX | NYLI MacKay High Yield Muni Bond Fund | Fixed Income | A |
|
High Yield Muni | 170 | 1.57 1.57 -1.48 -1.48 | 3.71 3.71 0.60 0.60 | 4.45 4.45 3.39 3.39 | 1.00 1.00 0.08 0.08 | 3.14 3.14 2.67 2.67 | 5.17 5.17 4.87 4.87 | 03/31/2010 |
| MMHVX | NYLI MacKay High Yield Muni Bond Fund | Fixed Income | IN |
|
High Yield Muni | 170 | 1.48 1.48 -1.06 -1.06 | 3.70 3.70 1.10 1.10 | 4.46 4.46 3.59 3.59 | 0.99 0.99 0.17 0.17 | 3.14 3.14 2.66 2.66 | 5.15 5.15 4.84 4.84 | 03/31/2010 |
| MMHEX | NYLI MacKay High Yield Muni Bond Fund | Fixed Income | R6 |
|
High Yield Muni | 170 | 1.66 1.66 - - | 4.03 4.03 - - | 4.80 4.80 - - | 1.31 1.31 - - | - - - - | 2.24 2.24 - - | 11/01/2019 |
| FCUPX | NYLI PineStone U.S. Equity Fund | Equities | P | - | Large Blend | 1212 | 0.39 0.39 - - | 4.14 4.14 - - | - - - - | - - - - | - - - - | 8.00 8.00 - - | 08/28/2023 |
| FCUDX | NYLI PineStone U.S. Equity Fund | Equities | R6 | - | Large Blend | 1212 | 0.39 0.39 - - | 4.14 4.14 - - | - - - - | - - - - | - - - - | 7.98 7.98 - - | 08/28/2023 |
| FCUIX | NYLI PineStone U.S. Equity Fund | Equities | I |
|
Large Blend | 1212 | 0.34 0.34 - - | 4.01 4.01 - - | 9.35 9.35 - - | 8.32 8.32 - - | - - - - | 12.23 12.23 - - | 09/30/2019 |
| FCUCX | NYLI PineStone U.S. Equity Fund | Equities | C | - | Large Blend | 1212 | 0.05 0.05 -0.95 -0.95 | 2.84 2.84 1.84 1.84 | - - - - | - - - - | - - - - | 6.70 6.70 6.70 6.70 | 08/28/2023 |
| FCUEX | NYLI PineStone U.S. Equity Fund | Equities | A |
|
Large Blend | 1212 | 0.25 0.25 -5.27 -5.27 | 3.75 3.75 -1.95 -1.95 | 9.09 9.09 9.09 9.09 | 8.06 8.06 8.06 8.06 | - - - - | 11.96 11.96 11.96 11.96 | 09/30/2019 |
| MMD | NYLI MacKay DefinedTerm Muni Opportunities Fund | Fixed Income | - |
|
Muni National Long | 152 | 1.47 1.47 3.90 3.90 | 4.30 4.30 3.33 3.33 | 2.52 2.52 -0.53 -0.53 | -0.31 -0.31 -3.00 -3.00 | 2.91 2.91 2.35 2.35 | 4.38 4.38 3.52 3.52 | 06/26/2012 |
| MYHCX | NYLI MacKay High Yield Corporate Bond Fund | Fixed Income | C |
|
High Yield Bond | 581 | 0.61 0.61 -0.38 -0.38 | 4.21 4.21 3.22 3.22 | 5.83 5.83 5.83 5.83 | 2.86 2.86 2.86 2.86 | 4.53 4.53 4.53 4.53 | 5.44 5.44 5.44 5.44 | 09/01/1998 |
| MHCAX | NYLI MacKay High Yield Corporate Bond Fund | Fixed Income | A |
|
High Yield Bond | 581 | 1.05 1.05 -3.50 -3.50 | 5.39 5.39 0.65 0.65 | 6.87 6.87 5.24 5.24 | 3.85 3.85 2.90 2.90 | 5.44 5.44 4.96 4.96 | 6.95 6.95 6.79 6.79 | 01/03/1995 |
| MHHIX | NYLI MacKay High Yield Corporate Bond Fund | Fixed Income | IN |
|
High Yield Bond | 581 | 0.79 0.79 -3.24 -3.24 | 4.94 4.94 0.74 0.74 | 6.62 6.62 5.18 5.18 | 3.66 3.66 2.82 2.82 | 5.33 5.33 4.84 4.84 | 5.65 5.65 5.39 5.39 | 02/28/2008 |
| MHYIX | NYLI MacKay High Yield Corporate Bond Fund | Fixed Income | I |
|
High Yield Bond | 581 | 1.11 1.11 - - | 5.45 5.45 - - | 7.13 7.13 - - | 4.11 4.11 - - | 5.71 5.71 - - | 6.10 6.10 - - | 01/02/2004 |
| MHYRX | NYLI MacKay High Yield Corporate Bond Fund | Fixed Income | R2 |
|
High Yield Bond | 581 | 1.02 1.02 - - | 5.09 5.09 - - | 6.76 6.76 - - | 3.74 3.74 - - | 5.34 5.34 - - | 5.57 5.57 - - | 05/01/2008 |
| MHHSX | NYLI MacKay High Yield Corporate Bond Fund | Fixed Income | SI |
|
High Yield Bond | 581 | 0.80 0.80 - - | 5.15 5.15 - - | 6.60 6.60 - - | 3.55 3.55 - - | - - - - | 4.07 4.07 - - | 08/31/2020 |
| MHYTX | NYLI MacKay High Yield Corporate Bond Fund | Fixed Income | R3 |
|
High Yield Bond | 581 | 0.77 0.77 - - | 4.83 4.83 - - | 6.44 6.44 - - | 3.45 3.45 - - | 5.09 5.09 - - | 5.42 5.42 - - | 02/29/2016 |
| MHYSX | NYLI MacKay High Yield Corporate Bond Fund | Fixed Income | R6 |
|
High Yield Bond | 581 | 0.96 0.96 - - | 5.62 5.62 - - | 7.25 7.25 - - | 4.24 4.24 - - | 5.85 5.85 - - | 5.06 5.06 - - | 06/17/2013 |
| MGDIX | NYLI Growth Allocation Fund | Multi-Asset | I |
|
Global Moderately Aggressive Allocation | 172 | 3.78 3.78 - - | 13.60 13.60 - - | 10.65 10.65 - - | 6.06 6.06 - - | 8.24 8.24 - - | 7.15 7.15 - - | 04/04/2005 |
| MGDCX | NYLI Growth Allocation Fund | Multi-Asset | C |
|
Global Moderately Aggressive Allocation | 172 | 3.45 3.45 2.45 2.45 | 12.28 12.28 11.28 11.28 | 9.34 9.34 9.34 9.34 | 4.78 4.78 4.78 4.78 | 6.95 6.95 6.95 6.95 | 5.92 5.92 5.92 5.92 | 04/04/2005 |
| MGDAX | NYLI Growth Allocation Fund | Multi-Asset | A |
|
Global Moderately Aggressive Allocation | 172 | 3.78 3.78 0.67 0.67 | 13.28 13.28 9.88 9.88 | 10.39 10.39 9.27 9.27 | 5.80 5.80 5.16 5.16 | 7.96 7.96 7.36 7.36 | 6.87 6.87 6.58 6.58 | 04/04/2005 |
| MGDNX | NYLI Growth Allocation Fund | Multi-Asset | IN |
|
Global Moderately Aggressive Allocation | 172 | 3.64 3.64 1.05 1.05 | 13.10 13.10 10.27 10.27 | 10.17 10.17 9.25 9.25 | 5.58 5.58 5.04 5.04 | 7.76 7.76 7.16 7.16 | 6.45 6.45 6.12 6.12 | 02/28/2008 |
| MGDSX | NYLI Growth Allocation Fund | Multi-Asset | SI |
|
Global Moderately Aggressive Allocation | 172 | 3.65 3.65 - - | 13.05 13.05 - - | 10.09 10.09 - - | 5.44 5.44 - - | - - - - | 7.36 7.36 - - | 08/31/2020 |
| MDARX | NYLI Moderate ETF Allocation Fund | Multi-Asset | R3 |
|
Global Moderate Allocation | 408 | 3.29 3.29 - - | 13.36 13.36 - - | 9.98 9.98 - - | 5.22 5.22 - - | - - - - | 7.26 7.26 - - | 06/30/2020 |
| MDAIX | NYLI Moderate ETF Allocation Fund | Multi-Asset | I |
|
Global Moderate Allocation | 408 | 3.42 3.42 - - | 14.00 14.00 - - | 10.65 10.65 - - | 5.88 5.88 - - | - - - - | 7.91 7.91 - - | 06/30/2020 |
| MDAKX | NYLI Moderate ETF Allocation Fund | Multi-Asset | C |
|
Global Moderate Allocation | 408 | 3.11 3.11 2.11 2.11 | 12.85 12.85 11.85 11.85 | 9.49 9.49 9.49 9.49 | 4.75 4.75 4.75 4.75 | - - - - | 6.78 6.78 6.78 6.78 | 06/30/2020 |
| MDAVX | NYLI Moderate ETF Allocation Fund | Multi-Asset | SI |
|
Global Moderate Allocation | 408 | 3.29 3.29 - - | 13.49 13.49 - - | 10.05 10.05 - - | 5.28 5.28 - - | - - - - | 6.30 6.30 - - | 08/31/2020 |
| MDAAX | NYLI Moderate ETF Allocation Fund | Multi-Asset | A |
|
Global Moderate Allocation | 408 | 3.35 3.35 0.25 0.25 | 13.76 13.76 10.35 10.35 | 10.35 10.35 9.23 9.23 | 5.60 5.60 4.96 4.96 | - - - - | 7.62 7.62 7.05 7.05 | 06/30/2020 |
| ICEUX | NYLI Epoch International Choice Fund | Equities | I |
|
Foreign Large Blend | 655 | 9.59 9.59 - - | 21.65 21.65 - - | 10.73 10.73 - - | 5.81 5.81 - - | 7.16 7.16 - - | 6.57 6.57 - - | 12/31/1997 |
| ICEWX | NYLI Epoch International Choice Fund | Equities | C |
|
Foreign Large Blend | 655 | 9.19 9.19 8.19 8.19 | 20.06 20.06 19.06 19.06 | 9.27 9.27 9.27 9.27 | 4.41 4.41 4.41 4.41 | 5.78 5.78 5.78 5.78 | 2.97 2.97 2.97 2.97 | 09/01/2006 |
| ICEVX | NYLI Epoch International Choice Fund | Equities | A |
|
Foreign Large Blend | 655 | 9.51 9.51 3.49 3.49 | 21.36 21.36 14.68 14.68 | 10.43 10.43 8.37 8.37 | 5.52 5.52 4.34 4.34 | 6.88 6.88 6.28 6.28 | 3.96 3.96 3.66 3.66 | 09/01/2006 |
| ICELX | NYLI Epoch International Choice Fund | Equities | IN |
|
Foreign Large Blend | 655 | 9.40 9.40 3.93 3.93 | 20.95 20.95 14.91 14.91 | 10.09 10.09 8.23 8.23 | 5.21 5.21 4.13 4.13 | 6.61 6.61 6.01 6.01 | 3.17 3.17 2.85 2.85 | 04/29/2008 |
| ICERX | NYLI Epoch International Choice Fund | Equities | SI |
|
Foreign Large Blend | 655 | 9.44 9.44 - - | 21.00 21.00 - - | 10.14 10.14 - - | 5.13 5.13 - - | - - - - | 6.84 6.84 - - | 08/31/2020 |
| IWLG | NYLI Winslow Large Cap Growth ETF | Equities | - |
|
Large Growth | 998 | -3.79 -3.79 -3.87 -3.87 | 10.80 10.80 10.77 10.77 | 19.56 19.56 19.58 19.58 | - - - - | - - - - | 19.13 19.13 19.12 19.12 | 06/23/2022 |
| UTAHX | NYLI MacKay Utah Muni Fund | Fixed Income | Z |
|
Muni Single State Intermediate | 105 | 1.24 1.24 -1.80 -1.80 | 4.98 4.98 1.83 1.83 | 2.63 2.63 1.60 1.60 | 0.63 0.63 0.01 0.01 | 1.56 1.56 1.25 1.25 | 4.07 4.07 3.97 3.97 | 07/24/1992 |
| UTAYX | NYLI MacKay Utah Muni Fund | Fixed Income | I |
|
Muni Single State Intermediate | 105 | 1.30 1.30 - - | 5.33 5.33 - - | 2.90 2.90 - - | 0.84 0.84 - - | 1.77 1.77 - - | 4.01 4.01 - - | 05/21/1996 |
| UTACX | NYLI MacKay Utah Muni Fund | Fixed Income | C |
|
Muni Single State Intermediate | 105 | 1.25 1.25 0.25 0.25 | 4.66 4.66 3.66 3.66 | 2.10 2.10 2.10 2.10 | -0.01 -0.01 -0.01 -0.01 | 0.85 0.85 0.85 0.85 | 2.96 2.96 2.96 2.96 | 05/21/1996 |
| UTAVX | NYLI MacKay Utah Muni Fund | Fixed Income | A | - | Muni Single State Intermediate | 105 | 1.24 1.24 -1.80 -1.80 | 5.08 5.08 1.93 1.93 | - - - - | - - - - | - - - - | 3.37 3.37 1.54 1.54 | 07/22/2024 |
| MMCA | NYLI MacKay California Muni Intermediate ETF | Fixed Income | - |
|
Muni California Intermediate | 53 | 0.70 0.70 0.66 0.66 | 4.90 4.90 4.81 4.81 | 3.45 3.45 3.46 3.46 | - - - - | - - - - | -0.11 -0.11 -0.10 -0.10 | 12/21/2021 |
| MYIIX | NYLI WMC International Research Equity Fund | Equities | I |
|
Foreign Large Blend | 655 | 9.56 9.56 - - | 32.47 32.47 - - | 17.26 17.26 - - | 9.01 9.01 - - | 6.63 6.63 - - | 3.23 3.23 - - | 09/28/2007 |
| MYICX | NYLI WMC International Research Equity Fund | Equities | C |
|
Foreign Large Blend | 655 | 9.15 9.15 8.15 8.15 | 30.64 30.64 29.64 29.64 | 15.65 15.65 15.65 15.65 | 7.50 7.50 7.50 7.50 | 5.27 5.27 5.27 5.27 | 2.00 2.00 2.00 2.00 | 09/28/2007 |
| MYITX | NYLI WMC International Research Equity Fund | Equities | A |
|
Foreign Large Blend | 655 | 9.42 9.42 3.40 3.40 | 32.12 32.12 24.86 24.86 | 16.93 16.93 14.75 14.75 | 8.69 8.69 7.47 7.47 | 6.34 6.34 5.74 5.74 | 2.98 2.98 2.66 2.66 | 09/28/2007 |
| MYINX | NYLI WMC International Research Equity Fund | Equities | IN |
|
Foreign Large Blend | 655 | 9.45 9.45 3.98 3.98 | 31.73 31.73 25.14 25.14 | 16.50 16.50 14.52 14.52 | 8.32 8.32 7.22 7.22 | 6.07 6.07 5.47 5.47 | 3.59 3.59 3.27 3.27 | 02/28/2008 |
| MSCXX | NYLI Money Market Fund | Money Market | C | - | Prime Money Market | 124 | 0.85 0.85 - - | 3.40 3.40 - - | 4.11 4.11 - - | 2.86 2.86 - - | 1.74 1.74 - - | 1.77 1.77 - - | 09/01/1998 |
| MMAXX | NYLI Money Market Fund | Money Market | A | - | Prime Money Market | 124 | 0.92 0.92 - - | 3.69 3.69 - - | 4.40 4.40 - - | 3.08 3.08 - - | 1.92 1.92 - - | 2.23 2.23 - - | 01/03/1995 |
| MKTXX | NYLI Money Market Fund | Money Market | IN | - | Prime Money Market | 124 | 0.85 0.85 - - | 3.40 3.40 - - | 4.11 4.11 - - | 2.86 2.86 - - | 1.74 1.74 - - | 1.04 1.04 - - | 02/28/2008 |
| MIPXX | NYLI Money Market Fund | Money Market | SI | - | Prime Money Market | 124 | 0.94 0.94 - - | 3.75 3.75 - - | 4.44 4.44 - - | 3.06 3.06 - - | - - - - | 2.74 2.74 - - | 08/31/2020 |
| CSHZX | NYLI Cushing® MLP Premier Fund | Equities | I |
|
Energy Limited Partnership | 90 | 17.05 17.05 - - | 19.61 19.61 - - | 27.03 27.03 - - | 25.15 25.15 - - | 12.22 12.22 - - | 6.59 6.59 - - | 10/20/2010 |
| CSHCX | NYLI Cushing® MLP Premier Fund | Equities | C |
|
Energy Limited Partnership | 90 | 16.63 16.63 15.63 15.63 | 18.44 18.44 17.44 17.44 | 25.81 25.81 25.81 25.81 | 23.91 23.91 23.91 23.91 | 11.09 11.09 11.09 11.09 | 5.52 5.52 5.52 5.52 | 10/20/2010 |
| CSHNX | NYLI Cushing® MLP Premier Fund | Equities | IN |
|
Energy Limited Partnership | 90 | 16.90 16.90 11.05 11.05 | 19.41 19.41 13.43 13.43 | 26.76 26.76 24.61 24.61 | 24.88 24.88 23.60 23.60 | 11.97 11.97 11.34 11.34 | 4.73 4.73 4.23 4.23 | 07/11/2014 |
| CSHAX | NYLI Cushing® MLP Premier Fund | Equities | A |
|
Energy Limited Partnership | 90 | 16.96 16.96 10.53 10.53 | 19.28 19.28 12.72 12.72 | 26.73 26.73 24.36 24.36 | 24.84 24.84 23.44 23.44 | 11.94 11.94 11.31 11.31 | 6.33 6.33 5.94 5.94 | 10/20/2010 |
| MOINX | NYLI WMC Small Companies Fund | Equities | IN |
|
Small Blend | 580 | 9.80 9.80 4.31 4.31 | 26.81 26.81 20.47 20.47 | 13.70 13.70 11.77 11.77 | 4.21 4.21 3.15 3.15 | 6.77 6.77 6.17 6.17 | 7.36 7.36 7.02 7.02 | 02/28/2008 |
| MOPAX | NYLI WMC Small Companies Fund | Equities | A |
|
Small Blend | 580 | 9.92 9.92 3.88 3.88 | 27.21 27.21 20.22 20.22 | 14.01 14.01 11.88 11.88 | 4.50 4.50 3.33 3.33 | 7.07 7.07 6.46 6.46 | 7.04 7.04 6.77 6.77 | 01/02/2004 |
| MOPCX | NYLI WMC Small Companies Fund | Equities | C |
|
Small Blend | 580 | 9.58 9.58 8.58 8.58 | 25.90 25.90 24.90 24.90 | 12.87 12.87 12.87 12.87 | 3.44 3.44 3.44 3.44 | 5.98 5.98 5.98 5.98 | 7.70 7.70 7.70 7.70 | 12/30/2002 |
| MOPIX | NYLI WMC Small Companies Fund | Equities | I |
|
Small Blend | 580 | 10.00 10.00 - - | 27.50 27.50 - - | 14.30 14.30 - - | 4.77 4.77 - - | 7.33 7.33 - - | 9.21 9.21 - - | 01/12/1987 |
| EPLPX | NYLI Epoch U.S. Equity Yield Fund | Equities | A |
|
Large Value | 1048 | 6.63 6.63 0.77 0.77 | 15.03 15.03 8.70 8.70 | 15.07 15.07 12.92 12.92 | 10.56 10.56 9.32 9.32 | 9.98 9.98 9.36 9.36 | 11.79 11.79 11.42 11.42 | 02/03/2009 |
| EPLKX | NYLI Epoch U.S. Equity Yield Fund | Equities | C |
|
Large Value | 1048 | 6.32 6.32 5.32 5.32 | 13.84 13.84 12.84 12.84 | 13.91 13.91 13.91 13.91 | 9.45 9.45 9.45 9.45 | 8.91 8.91 8.91 8.91 | 9.57 9.57 9.57 9.57 | 11/16/2009 |
| EPLCX | NYLI Epoch U.S. Equity Yield Fund | Equities | I |
|
Large Value | 1048 | 6.76 6.76 - - | 15.43 15.43 - - | 15.45 15.45 - - | 10.93 10.93 - - | 10.32 10.32 - - | 12.15 12.15 - - | 12/03/2008 |
| EPLIX | NYLI Epoch U.S. Equity Yield Fund | Equities | IN |
|
Large Value | 1048 | 6.54 6.54 1.21 1.21 | 14.72 14.72 8.99 8.99 | 14.77 14.77 12.82 12.82 | 10.28 10.28 9.16 9.16 | 9.73 9.73 9.11 9.11 | 10.39 10.39 10.01 10.01 | 11/16/2009 |
| EPLDX | NYLI Epoch U.S. Equity Yield Fund | Equities | R6 |
|
Large Value | 1048 | 6.76 6.76 - - | 15.43 15.43 - - | 15.45 15.45 - - | 10.93 10.93 - - | - - - - | 10.18 10.18 - - | 05/08/2017 |
| EPLMX | NYLI Epoch U.S. Equity Yield Fund | Equities | SI |
|
Large Value | 1048 | 6.57 6.57 - - | 14.75 14.75 - - | 14.76 14.76 - - | 10.18 10.18 - - | - - - - | 12.30 12.30 - - | 08/31/2020 |
| MMPCX | NYLI WMC Value Fund | Equities | C |
|
Large Value | 1048 | 3.20 3.20 2.20 2.20 | 10.32 10.32 9.32 9.32 | 10.66 10.66 10.66 10.66 | 7.61 7.61 7.61 7.61 | 10.80 10.80 10.80 10.80 | 7.88 7.88 7.88 7.88 | 06/09/1999 |
| MAPAX | NYLI WMC Value Fund | Equities | A |
|
Large Value | 1048 | 3.51 3.51 -2.19 -2.19 | 11.42 11.42 5.29 5.29 | 11.75 11.75 9.66 9.66 | 8.69 8.69 7.47 7.47 | 11.90 11.90 11.27 11.27 | 8.84 8.84 8.61 8.61 | 06/09/1999 |
| MUBFX | NYLI WMC Value Fund | Equities | I |
|
Large Value | 1048 | 3.59 3.59 - - | 11.75 11.75 - - | 12.12 12.12 - - | 9.04 9.04 - - | 12.23 12.23 - - | 10.64 10.64 - - | 01/21/1971 |
| MSMIX | NYLI WMC Value Fund | Equities | IN |
|
Large Value | 1048 | 3.40 3.40 -1.77 -1.77 | 11.17 11.17 5.61 5.61 | 11.48 11.48 9.59 9.59 | 8.42 8.42 7.31 7.31 | 11.63 11.63 11.00 11.00 | 8.63 8.63 8.29 8.29 | 02/28/2008 |
| MMPDX | NYLI WMC Value Fund | Equities | R6 |
|
Large Value | 1048 | 3.60 3.60 - - | 11.77 11.77 - - | 12.12 12.12 - - | - - - - | - - - - | 7.99 7.99 - - | 04/26/2021 |
| AZTAX | NYLI MacKay Arizona Muni Fund | Fixed Income | A | - | Muni Single State Intermediate | 105 | 0.93 0.93 -2.10 -2.10 | 4.49 4.49 1.36 1.36 | - - - - | - - - - | - - - - | 3.06 3.06 1.23 1.23 | 07/22/2024 |
| AZTCX | NYLI MacKay Arizona Muni Fund | Fixed Income | C |
|
Muni Single State Intermediate | 105 | 0.85 0.85 -0.15 -0.15 | 4.19 4.19 3.19 3.19 | 2.05 2.05 2.05 2.05 | -0.06 -0.06 -0.06 -0.06 | 0.78 0.78 0.78 0.78 | 2.79 2.79 2.79 2.79 | 04/01/1996 |
| AZTYX | NYLI MacKay Arizona Muni Fund | Fixed Income | I |
|
Muni Single State Intermediate | 105 | 1.01 1.01 - - | 4.65 4.65 - - | 2.78 2.78 - - | 0.75 0.75 - - | 1.71 1.71 - - | 3.86 3.86 - - | 04/01/1996 |
| AZTFX | NYLI MacKay Arizona Muni Fund | Fixed Income | Z |
|
Muni Single State Intermediate | 105 | 0.85 0.85 -2.18 -2.18 | 4.58 4.58 1.44 1.44 | 2.65 2.65 1.61 1.61 | 0.64 0.64 0.02 0.02 | 1.57 1.57 1.27 1.27 | 4.62 4.62 4.54 4.54 | 03/13/1986 |
| MCYSX | NYLI Candriam Emerging Markets Equity Fund | Equities | R6 |
|
Diversified Emerging Markets | 694 | 16.00 16.00 - - | 41.83 41.83 - - | 18.16 18.16 - - | 3.26 3.26 - - | - - - - | 5.64 5.64 - - | 11/15/2017 |
| MCYIX | NYLI Candriam Emerging Markets Equity Fund | Equities | I |
|
Diversified Emerging Markets | 694 | 16.03 16.03 - - | 41.81 41.81 - - | 18.13 18.13 - - | 3.26 3.26 - - | - - - - | 5.63 5.63 - - | 11/15/2017 |
| MCYCX | NYLI Candriam Emerging Markets Equity Fund | Equities | C |
|
Diversified Emerging Markets | 694 | 15.65 15.65 14.65 14.65 | 40.08 40.08 39.08 39.08 | 16.72 16.72 16.72 16.72 | 1.98 1.98 1.98 1.98 | - - - - | 4.36 4.36 4.36 4.36 | 11/15/2017 |
| MCYVX | NYLI Candriam Emerging Markets Equity Fund | Equities | IN |
|
Diversified Emerging Markets | 694 | 15.88 15.88 10.09 10.09 | 41.23 41.23 34.17 34.17 | 17.60 17.60 15.60 15.60 | 2.76 2.76 1.71 1.71 | - - - - | 5.13 5.13 4.43 4.43 | 11/15/2017 |
| MCYAX | NYLI Candriam Emerging Markets Equity Fund | Equities | A |
|
Diversified Emerging Markets | 694 | 15.86 15.86 9.49 9.49 | 41.28 41.28 33.51 33.51 | 17.73 17.73 15.53 15.53 | 2.89 2.89 1.74 1.74 | - - - - | 5.27 5.27 4.56 4.56 | 11/15/2017 |
| MNOVX | NYLI MacKay New York Muni Fund | Fixed Income | IN |
|
Muni New York Long | 76 | 1.50 1.50 -1.03 -1.03 | 4.16 4.16 1.56 1.56 | 3.25 3.25 2.38 2.38 | 0.59 0.59 -0.23 -0.23 | 2.12 2.12 1.65 1.65 | 2.95 2.95 2.61 2.61 | 05/14/2012 |
| MNOIX | NYLI MacKay New York Muni Fund | Fixed Income | I |
|
Muni New York Long | 76 | 1.59 1.59 - - | 4.56 4.56 - - | 3.54 3.54 - - | 0.86 0.86 - - | 2.40 2.40 - - | 3.26 3.26 - - | 05/14/2012 |
| MNOCX | NYLI MacKay New York Muni Fund | Fixed Income | C |
|
Muni New York Long | 76 | 1.43 1.43 0.43 0.43 | 4.01 4.01 3.01 3.01 | 2.99 2.99 2.99 2.99 | 0.34 0.34 0.34 0.34 | 1.87 1.87 1.87 1.87 | 2.69 2.69 2.69 2.69 | 05/14/2012 |
| MNOAX | NYLI MacKay New York Muni Fund | Fixed Income | A |
|
Muni New York Long | 76 | 1.52 1.52 -1.53 -1.53 | 4.20 4.20 1.07 1.07 | 3.24 3.24 2.20 2.20 | 0.59 0.59 -0.33 -0.33 | 2.14 2.14 1.67 1.67 | 2.99 2.99 2.65 2.65 | 05/14/2012 |
| MNODX | NYLI MacKay New York Muni Fund | Fixed Income | R6 |
|
Muni New York Long | 76 | 1.59 1.59 - - | 4.48 4.48 - - | 3.52 3.52 - - | 0.87 0.87 - - | - - - - | 1.57 1.57 - - | 11/01/2019 |
| MNOLX | NYLI MacKay New York Muni Fund | Fixed Income | C2 |
|
Muni New York Long | 76 | 1.39 1.39 0.39 0.39 | 3.75 3.75 2.75 2.75 | 2.84 2.84 2.84 2.84 | 0.19 0.19 0.19 0.19 | - - - - | 0.57 0.57 0.57 0.57 | 08/31/2020 |
| EPSIX | NYLI Epoch Global Equity Yield Fund | Equities | IN |
|
Global Large-Stock Value | 139 | 9.06 9.06 3.61 3.61 | 23.00 23.00 16.85 16.85 | 16.98 16.98 15.00 15.00 | 11.09 11.09 9.95 9.95 | 8.66 8.66 8.05 8.05 | 8.93 8.93 8.56 8.56 | 11/16/2009 |
| EPSYX | NYLI Epoch Global Equity Yield Fund | Equities | I |
|
Global Large-Stock Value | 139 | 9.15 9.15 - - | 23.34 23.34 - - | 17.36 17.36 - - | 11.44 11.44 - - | 8.98 8.98 - - | 7.89 7.89 - - | 12/27/2005 |
| EPSKX | NYLI Epoch Global Equity Yield Fund | Equities | C |
|
Global Large-Stock Value | 139 | 8.82 8.82 7.82 7.82 | 22.12 22.12 21.12 21.12 | 16.19 16.19 16.19 16.19 | 10.32 10.32 10.32 10.32 | 7.89 7.89 7.89 7.89 | 8.15 8.15 8.15 8.15 | 11/16/2009 |
| EPSPX | NYLI Epoch Global Equity Yield Fund | Equities | A |
|
Global Large-Stock Value | 139 | 9.10 9.10 3.10 3.10 | 23.02 23.02 16.25 16.25 | 17.05 17.05 14.86 14.86 | 11.16 11.16 9.91 9.91 | 8.70 8.70 8.09 8.09 | 7.40 7.40 7.09 7.09 | 08/02/2006 |
| EPSRX | NYLI Epoch Global Equity Yield Fund | Equities | R6 |
|
Global Large-Stock Value | 139 | 9.17 9.17 - - | 23.46 23.46 - - | 17.47 17.47 - - | 11.55 11.55 - - | 8.96 8.96 - - | 8.42 8.42 - - | 06/17/2013 |
| MBINX | NYLI Balanced Fund | Multi-Asset | IN |
|
Moderate Allocation | 465 | 2.28 2.28 -0.28 -0.28 | 8.13 8.13 5.42 5.42 | 8.15 8.15 7.24 7.24 | 5.19 5.19 4.66 4.66 | 6.35 6.35 5.75 5.75 | 6.25 6.25 5.92 5.92 | 02/28/2008 |
| MBAIX | NYLI Balanced Fund | Multi-Asset | I |
|
Moderate Allocation | 465 | 2.44 2.44 - - | 8.69 8.69 - - | 8.70 8.70 - - | 5.73 5.73 - - | 6.86 6.86 - - | 8.22 8.22 - - | 05/01/1989 |
| MBACX | NYLI Balanced Fund | Multi-Asset | C |
|
Moderate Allocation | 465 | 2.06 2.06 1.06 1.06 | 7.32 7.32 6.32 6.32 | 7.34 7.34 7.34 7.34 | 4.41 4.41 4.41 4.41 | 5.55 5.55 5.55 5.55 | 6.11 6.11 6.11 6.11 | 12/30/2002 |
| MBNAX | NYLI Balanced Fund | Multi-Asset | A |
|
Moderate Allocation | 465 | 2.38 2.38 -0.69 -0.69 | 8.39 8.39 5.14 5.14 | 8.43 8.43 7.33 7.33 | 5.46 5.46 4.82 4.82 | 6.59 6.59 5.99 5.99 | 6.38 6.38 6.11 6.11 | 01/02/2004 |
| MBERX | NYLI Balanced Fund | Multi-Asset | R6 |
|
Moderate Allocation | 465 | 2.46 2.46 - - | 8.77 8.77 - - | 8.80 8.80 - - | 5.82 5.82 - - | - - - - | 6.39 6.39 - - | 12/15/2017 |
| MTMIX | NYLI MacKay Total Return Bond Fund | Fixed Income | I |
|
Intermediate Core-Plus Bond | 496 | 1.18 1.18 - - | 4.65 4.65 - - | 5.59 5.59 - - | 1.21 1.21 - - | 2.65 2.65 - - | 4.90 4.90 - - | 01/02/1991 |
| MTMCX | NYLI MacKay Total Return Bond Fund | Fixed Income | C |
|
Intermediate Core-Plus Bond | 496 | 0.82 0.82 -0.18 -0.18 | 3.27 3.27 2.27 2.27 | 4.12 4.12 4.12 4.12 | -0.18 -0.18 -0.18 -0.18 | 1.36 1.36 1.36 1.36 | 2.54 2.54 2.54 2.54 | 01/02/2004 |
| MTMAX | NYLI MacKay Total Return Bond Fund | Fixed Income | A |
|
Intermediate Core-Plus Bond | 496 | 0.98 0.98 -3.57 -3.57 | 4.36 4.36 -0.34 -0.34 | 5.22 5.22 3.61 3.61 | 0.86 0.86 -0.07 -0.07 | 2.32 2.32 1.85 1.85 | 3.43 3.43 3.22 3.22 | 01/02/2004 |
| MTMNX | NYLI MacKay Total Return Bond Fund | Fixed Income | IN |
|
Intermediate Core-Plus Bond | 496 | 1.01 1.01 -3.03 -3.03 | 4.04 4.04 -0.12 -0.12 | 4.90 4.90 3.48 3.48 | 0.58 0.58 -0.24 -0.24 | 2.12 2.12 1.65 1.65 | 3.17 3.17 2.90 2.90 | 02/28/2008 |
| MTRDX | NYLI MacKay Total Return Bond Fund | Fixed Income | R6 |
|
Intermediate Core-Plus Bond | 496 | 1.18 1.18 - - | 4.77 4.77 - - | 5.64 5.64 - - | 1.22 1.22 - - | 2.69 2.69 - - | 2.54 2.54 - - | 12/29/2014 |
| MTMSX | NYLI MacKay Total Return Bond Fund | Fixed Income | SI |
|
Intermediate Core-Plus Bond | 496 | 1.04 1.04 - - | 4.05 4.05 - - | 4.98 4.98 - - | 0.54 0.54 - - | - - - - | 0.23 0.23 - - | 08/31/2020 |
| MSTIX | NYLI MacKay Short Term Muni Fund | Fixed Income | I |
|
Muni National Short | 205 | 0.79 0.79 - - | 3.93 3.93 - - | 3.45 3.45 - - | 1.71 1.71 - - | 1.66 1.66 - - | 3.39 3.39 - - | 01/02/1991 |
| MSTAX | NYLI MacKay Short Term Muni Fund | Fixed Income | A |
|
Muni National Short | 205 | 0.71 0.71 -0.30 -0.30 | 3.65 3.65 2.61 2.61 | 3.16 3.16 2.82 2.82 | 1.43 1.43 1.23 1.23 | 1.38 1.38 1.28 1.28 | 1.75 1.75 1.61 1.61 | 01/02/2004 |
| MYTBX | NYLI MacKay Short Term Muni Fund | Fixed Income | IN |
|
Muni National Short | 205 | 0.62 0.62 0.12 0.12 | 3.31 3.31 2.80 2.80 | 2.83 2.83 2.66 2.66 | 1.11 1.11 1.01 1.01 | 1.02 1.02 0.92 0.92 | 1.09 1.09 0.92 0.92 | 02/28/2008 |
| MSTEX | NYLI MacKay Short Term Muni Fund | Fixed Income | R6 |
|
Muni National Short | 205 | 0.79 0.79 - - | 3.94 3.94 - - | 3.46 3.46 - - | - - - - | - - - - | 3.08 3.08 - - | 05/02/2022 |
| MSTUX | NYLI MacKay Short Term Muni Fund | Fixed Income | A2 |
|
Muni National Short | 205 | 0.71 0.71 -1.30 -1.30 | 3.64 3.64 1.57 1.57 | 3.16 3.16 2.47 2.47 | 1.43 1.43 1.02 1.02 | - - - - | 1.40 1.40 1.03 1.03 | 09/30/2020 |
| APSDX | NYLI Fiera SMID Growth Fund | Equities | R6 | - | Mid-Cap Growth | 469 | -1.65 -1.65 - - | 10.93 10.93 - - | - - - - | - - - - | - - - - | 3.90 3.90 - - | 07/24/2023 |
| APSGX | NYLI Fiera SMID Growth Fund | Equities | I |
|
Mid-Cap Growth | 469 | -1.70 -1.70 - - | 11.01 11.01 - - | 7.61 7.61 - - | 1.92 1.92 - - | 10.62 10.62 - - | 10.89 10.89 - - | 06/29/2012 |
| APSLX | NYLI Fiera SMID Growth Fund | Equities | C | - | Mid-Cap Growth | 469 | -1.98 -1.98 -2.96 -2.96 | 9.65 9.65 8.65 8.65 | - - - - | - - - - | - - - - | 2.67 2.67 2.67 2.67 | 07/24/2023 |
| APSRX | NYLI Fiera SMID Growth Fund | Equities | A |
|
Mid-Cap Growth | 469 | -1.76 -1.76 -7.16 -7.16 | 10.66 10.66 4.58 4.58 | 7.28 7.28 7.28 7.28 | 1.65 1.65 1.65 1.65 | - - - - | 8.56 8.56 8.56 8.56 | 02/12/2018 |
| MMSD | NYLI MacKay Muni Short Duration ETF | Fixed Income | - | - | Muni National Short | 205 | 0.88 0.88 0.96 0.96 | - - - - | - - - - | - - - - | - - - - | 4.29 4.29 4.31 4.31 | 05/06/2025 |
| MCKNX | NYLI Conservative Allocation Fund | Multi-Asset | IN |
|
Global Moderately Conservative Allocation | 220 | 2.48 2.48 -0.08 -0.08 | 9.17 9.17 6.44 6.44 | 7.34 7.34 6.44 6.44 | 3.40 3.40 2.88 2.88 | 4.98 4.98 4.38 4.38 | 4.94 4.94 4.61 4.61 | 02/28/2008 |
| MCKAX | NYLI Conservative Allocation Fund | Multi-Asset | A |
|
Global Moderately Conservative Allocation | 220 | 2.53 2.53 -0.54 -0.54 | 9.28 9.28 6.00 6.00 | 7.54 7.54 6.45 6.45 | 3.59 3.59 2.97 2.97 | 5.15 5.15 4.56 4.56 | 5.25 5.25 4.97 4.97 | 04/04/2005 |
| MCKCX | NYLI Conservative Allocation Fund | Multi-Asset | C |
|
Global Moderately Conservative Allocation | 220 | 2.25 2.25 1.25 1.25 | 8.26 8.26 7.26 7.26 | 6.54 6.54 6.54 6.54 | 2.62 2.62 2.62 2.62 | 4.19 4.19 4.19 4.19 | 4.34 4.34 4.34 4.34 | 04/04/2005 |
| MCKIX | NYLI Conservative Allocation Fund | Multi-Asset | I |
|
Global Moderately Conservative Allocation | 220 | 2.64 2.64 - - | 9.60 9.60 - - | 7.79 7.79 - - | 3.85 3.85 - - | 5.43 5.43 - - | 5.54 5.54 - - | 04/04/2005 |
| MCKSX | NYLI Conservative Allocation Fund | Multi-Asset | SI |
|
Global Moderately Conservative Allocation | 220 | 2.49 2.49 - - | 9.01 9.01 - - | 7.26 7.26 - - | 3.24 3.24 - - | - - - - | 3.98 3.98 - - | 08/31/2020 |
| MMMA | NYLI MacKay Muni Allocation ETF | Fixed Income | - | - | Muni National Long | 152 | 2.14 2.14 2.28 2.28 | - - - - | - - - - | - - - - | - - - - | 1.41 1.41 1.40 1.40 | 12/16/2025 |
| MNEAX | NYLI Conservative ETF Allocation Fund | Multi-Asset | A |
|
Global Moderately Conservative Allocation | 220 | 2.58 2.58 -0.50 -0.50 | 10.64 10.64 7.32 7.32 | 7.87 7.87 6.78 6.78 | 3.87 3.87 3.24 3.24 | - - - - | 5.09 5.09 4.53 4.53 | 06/30/2020 |
| MNEVX | NYLI Conservative ETF Allocation Fund | Multi-Asset | SI |
|
Global Moderately Conservative Allocation | 220 | 2.53 2.53 - - | 10.40 10.40 - - | 7.60 7.60 - - | 3.60 3.60 - - | - - - - | 4.13 4.13 - - | 08/31/2020 |
| MNEKX | NYLI Conservative ETF Allocation Fund | Multi-Asset | C |
|
Global Moderately Conservative Allocation | 220 | 2.31 2.31 1.31 1.31 | 9.83 9.83 8.83 8.83 | 7.05 7.05 7.05 7.05 | 3.08 3.08 3.08 3.08 | - - - - | 4.29 4.29 4.29 4.29 | 06/30/2020 |
| MNERX | NYLI Conservative ETF Allocation Fund | Multi-Asset | R3 |
|
Global Moderately Conservative Allocation | 220 | 2.50 2.50 - - | 10.29 10.29 - - | 7.51 7.51 - - | 3.49 3.49 - - | - - - - | 4.71 4.71 - - | 06/30/2020 |
| MNELX | NYLI Conservative ETF Allocation Fund | Multi-Asset | I |
|
Global Moderately Conservative Allocation | 220 | 2.65 2.65 - - | 10.93 10.93 - - | 8.15 8.15 - - | 4.12 4.12 - - | - - - - | 5.34 5.34 - - | 06/30/2020 |
| HFXI | NYLI FTSE International Equity Currency Neutral ETF | Equities | - |
|
Foreign Large Blend | 655 | 10.10 10.10 10.90 10.90 | 25.82 25.82 27.91 27.91 | 16.13 16.13 16.89 16.89 | 10.34 10.34 10.81 10.81 | 10.17 10.17 10.42 10.42 | 8.18 8.18 8.42 8.42 | 07/22/2015 |
| MDHIX | NYLI MacKay Short Duration High Income Fund | Fixed Income | I |
|
High Yield Bond | 581 | 0.90 0.90 - - | 5.25 5.25 - - | 6.72 6.72 - - | 4.67 4.67 - - | 5.19 5.19 - - | 4.65 4.65 - - | 12/17/2012 |
| MDHCX | NYLI MacKay Short Duration High Income Fund | Fixed Income | C |
|
High Yield Bond | 581 | 0.65 0.65 -0.34 -0.34 | 4.09 4.09 3.10 3.10 | 5.60 5.60 5.60 5.60 | 3.56 3.56 3.56 3.56 | 4.08 4.08 4.08 4.08 | 3.53 3.53 3.53 3.53 | 12/17/2012 |
| MDHAX | NYLI MacKay Short Duration High Income Fund | Fixed Income | A |
|
High Yield Bond | 581 | 0.84 0.84 -2.18 -2.18 | 5.00 5.00 1.85 1.85 | 6.47 6.47 5.39 5.39 | 4.42 4.42 3.79 3.79 | 4.93 4.93 4.62 4.62 | 4.40 4.40 4.16 4.16 | 12/17/2012 |
| MDHVX | NYLI MacKay Short Duration High Income Fund | Fixed Income | IN |
|
High Yield Bond | 581 | 0.84 0.84 -1.68 -1.68 | 4.86 4.86 2.24 2.24 | 6.41 6.41 5.52 5.52 | 4.36 4.36 3.83 3.83 | 4.87 4.87 4.55 4.55 | 4.31 4.31 4.07 4.07 | 12/17/2012 |
| IWFG | NYLI Winslow Focused Large Cap Growth ETF | Equities | - |
|
Large Growth | 998 | -5.10 -5.10 -5.24 -5.24 | 8.96 8.96 8.86 8.86 | 19.51 19.51 19.48 19.48 | - - - - | - - - - | 19.95 19.95 19.93 19.93 | 06/23/2022 |
| MGXNX | NYLI Equity Allocation Fund | Multi-Asset | IN |
|
Global Aggressive Allocation | 133 | 4.12 4.12 1.52 1.52 | 14.80 14.80 11.93 11.93 | 11.55 11.55 10.61 10.61 | 6.12 6.12 5.58 5.58 | 8.83 8.83 8.22 8.22 | 6.75 6.75 6.42 6.42 | 02/28/2008 |
| MGXAX | NYLI Equity Allocation Fund | Multi-Asset | A |
|
Global Aggressive Allocation | 133 | 4.18 4.18 1.05 1.05 | 15.00 15.00 11.55 11.55 | 11.74 11.74 10.62 10.62 | 6.30 6.30 5.65 5.65 | 9.01 9.01 8.40 8.40 | 7.22 7.22 6.94 6.94 | 04/04/2005 |
| MGXIX | NYLI Equity Allocation Fund | Multi-Asset | I |
|
Global Aggressive Allocation | 133 | 4.28 4.28 - - | 15.31 15.31 - - | 12.01 12.01 - - | 6.57 6.57 - - | 9.28 9.28 - - | 7.52 7.52 - - | 04/04/2005 |
| MGXCX | NYLI Equity Allocation Fund | Multi-Asset | C |
|
Global Aggressive Allocation | 133 | 3.90 3.90 2.90 2.90 | 13.97 13.97 12.97 12.97 | 10.70 10.70 10.70 10.70 | 5.32 5.32 5.32 5.32 | 8.02 8.02 8.02 8.02 | 6.31 6.31 6.31 6.31 | 04/04/2005 |
| MGXSX | NYLI Equity Allocation Fund | Multi-Asset | SI |
|
Global Aggressive Allocation | 133 | 4.14 4.14 - - | 14.75 14.75 - - | 11.45 11.45 - - | 5.96 5.96 - - | - - - - | 8.54 8.54 - - | 08/31/2020 |
| MXFIX | NYLI Floating Rate Fund | Fixed Income | I |
|
Bank Loan | 203 | -0.20 -0.20 - - | 4.16 4.16 - - | 7.22 7.22 - - | 5.20 5.20 - - | 4.79 4.79 - - | 4.20 4.20 - - | 05/03/2004 |
| MXFCX | NYLI Floating Rate Fund | Fixed Income | C |
|
Bank Loan | 203 | -0.53 -0.53 -1.51 -1.51 | 2.97 2.97 2.00 2.00 | 6.00 6.00 6.00 6.00 | 3.99 3.99 3.99 3.99 | 3.68 3.68 3.68 3.68 | 3.10 3.10 3.10 3.10 | 05/03/2004 |
| MXFAX | NYLI Floating Rate Fund | Fixed Income | A |
|
Bank Loan | 203 | -0.27 -0.27 -3.26 -3.26 | 3.90 3.90 0.78 0.78 | 6.95 6.95 5.87 5.87 | 4.93 4.93 4.30 4.30 | 4.53 4.53 4.21 4.21 | 3.93 3.93 3.79 3.79 | 05/03/2004 |
| MXFNX | NYLI Floating Rate Fund | Fixed Income | IN |
|
Bank Loan | 203 | -0.32 -0.32 -2.81 -2.81 | 3.74 3.74 1.15 1.15 | 6.79 6.79 5.89 5.89 | 4.80 4.80 4.27 4.27 | 4.46 4.46 4.14 4.14 | 4.22 4.22 4.04 4.04 | 02/28/2008 |
| MXFEX | NYLI Floating Rate Fund | Fixed Income | R6 |
|
Bank Loan | 203 | -0.18 -0.18 - - | 4.23 4.23 - - | 7.25 7.25 - - | 5.26 5.26 - - | - - - - | 4.86 4.86 - - | 02/28/2019 |
| MXFMX | NYLI Floating Rate Fund | Fixed Income | SI |
|
Bank Loan | 203 | -0.34 -0.34 - - | 3.65 3.65 - - | 6.68 6.68 - - | 4.61 4.61 - - | - - - - | 4.96 4.96 - - | 08/31/2020 |
| QAI | NYLI Hedge Multi-Strategy Tracker ETF | Alternatives | - |
|
Multistrategy | 104 | 5.02 5.02 5.07 5.07 | 10.52 10.52 10.54 10.54 | 8.00 8.00 8.02 8.02 | 3.49 3.49 3.47 3.47 | 3.30 3.30 3.31 3.31 | 3.26 3.26 3.26 3.26 | 03/25/2009 |
| LRND | NYLI U.S. Large Cap R&D Leaders ETF | Equities | - |
|
Large Growth | 998 | -0.67 -0.67 -0.76 -0.76 | 16.44 16.44 16.43 16.43 | 18.57 18.57 18.54 18.54 | - - - - | - - - - | 11.43 11.43 11.43 11.43 | 02/08/2022 |
| MSICX | NYLI MacKay Strategic Bond Fund | Fixed Income | C |
|
Multisector Bond | 339 | 0.98 0.98 -0.02 -0.02 | 4.61 4.61 3.61 3.61 | 6.09 6.09 6.09 6.09 | 2.44 2.44 2.44 2.44 | 3.04 3.04 3.04 3.04 | 3.94 3.94 3.94 3.94 | 09/01/1998 |
| MASAX | NYLI MacKay Strategic Bond Fund | Fixed Income | A |
|
Multisector Bond | 339 | 1.33 1.33 -3.23 -3.23 | 5.59 5.59 0.84 0.84 | 7.12 7.12 5.49 5.49 | 3.42 3.42 2.47 2.47 | 3.95 3.95 3.47 3.47 | 4.84 4.84 4.67 4.67 | 02/28/1997 |
| MSDIX | NYLI MacKay Strategic Bond Fund | Fixed Income | I |
|
Multisector Bond | 339 | 1.40 1.40 - - | 5.86 5.86 - - | 7.43 7.43 - - | 3.73 3.73 - - | 4.23 4.23 - - | 4.70 4.70 - - | 01/02/2004 |
| MSYDX | NYLI MacKay Strategic Bond Fund | Fixed Income | IN |
|
Multisector Bond | 339 | 1.26 1.26 -2.79 -2.79 | 5.39 5.39 1.17 1.17 | 6.93 6.93 5.48 5.48 | 3.22 3.22 2.38 2.38 | 3.82 3.82 3.34 3.34 | 4.17 4.17 3.90 3.90 | 02/28/2008 |
| MSYEX | NYLI MacKay Strategic Bond Fund | Fixed Income | R6 |
|
Multisector Bond | 339 | 1.41 1.41 - - | 5.93 5.93 - - | 7.52 7.52 - - | 3.78 3.78 - - | - - - - | 3.93 3.93 - - | 02/28/2018 |
| SECR | NYLI MacKay Securitized Income ETF | Fixed Income | - | - | Securitized Bond - Diversified | 86 | 1.21 1.21 1.29 1.29 | 5.02 5.02 5.03 5.03 | 5.25 5.25 - - | 1.29 1.29 - - | - - - - | 7.35 7.35 7.43 7.43 | 05/31/2024 |
| MCOIX | NYLI MacKay California Muni Fund | Fixed Income | I |
|
Muni California Long | 101 | 1.01 1.01 - - | 3.46 3.46 - - | 3.37 3.37 - - | 0.66 0.66 - - | 2.38 2.38 - - | 3.07 3.07 - - | 02/28/2013 |
| MSCCX | NYLI MacKay California Muni Fund | Fixed Income | C |
|
Muni California Long | 101 | 0.96 0.96 -0.04 -0.04 | 2.91 2.91 1.92 1.92 | 2.83 2.83 2.83 2.83 | 0.13 0.13 0.13 0.13 | 1.84 1.84 1.84 1.84 | 2.50 2.50 2.50 2.50 | 02/28/2013 |
| MSCAX | NYLI MacKay California Muni Fund | Fixed Income | A |
|
Muni California Long | 101 | 0.94 0.94 -2.09 -2.09 | 3.21 3.21 0.11 0.11 | 3.12 3.12 2.07 2.07 | 0.41 0.41 -0.51 -0.51 | 2.13 2.13 1.66 1.66 | 2.81 2.81 2.45 2.45 | 02/28/2013 |
| MSCVX | NYLI MacKay California Muni Fund | Fixed Income | IN |
|
Muni California Long | 101 | 1.03 1.03 -1.50 -1.50 | 3.17 3.17 0.59 0.59 | 3.08 3.08 2.22 2.22 | 0.38 0.38 -0.43 -0.43 | 2.10 2.10 1.63 1.63 | 2.77 2.77 2.40 2.40 | 02/28/2013 |
| MSODX | NYLI MacKay California Muni Fund | Fixed Income | R6 |
|
Muni California Long | 101 | 1.12 1.12 - - | 3.58 3.58 - - | 3.42 3.42 - - | 0.70 0.70 - - | - - - - | 1.42 1.42 - - | 11/01/2019 |
| MCAMX | NYLI MacKay California Muni Fund | Fixed Income | C2 |
|
Muni California Long | 101 | 0.91 0.91 -0.09 -0.09 | 2.87 2.87 1.87 1.87 | 2.71 2.71 2.71 2.71 | 0.00 0.00 0.00 0.00 | - - - - | 0.37 0.37 0.37 0.37 | 08/31/2020 |
| MOERX | NYLI Growth ETF Allocation Fund | Multi-Asset | R3 |
|
Global Moderately Aggressive Allocation | 172 | 4.46 4.46 - - | 16.65 16.65 - - | 12.18 12.18 - - | 6.61 6.61 - - | - - - - | 9.74 9.74 - - | 06/30/2020 |
| MOEIX | NYLI Growth ETF Allocation Fund | Multi-Asset | I |
|
Global Moderately Aggressive Allocation | 172 | 4.59 4.59 - - | 17.22 17.22 - - | 12.83 12.83 - - | 7.23 7.23 - - | - - - - | 10.39 10.39 - - | 06/30/2020 |
| MOECX | NYLI Growth ETF Allocation Fund | Multi-Asset | C |
|
Global Moderately Aggressive Allocation | 172 | 4.32 4.32 3.32 3.32 | 16.11 16.11 15.11 15.11 | 11.71 11.71 11.71 11.71 | 6.18 6.18 6.18 6.18 | - - - - | 9.30 9.30 9.30 9.30 | 06/30/2020 |
| MOEVX | NYLI Growth ETF Allocation Fund | Multi-Asset | SI |
|
Global Moderately Aggressive Allocation | 172 | 4.46 4.46 - - | 16.71 16.71 - - | 12.28 12.28 - - | 6.72 6.72 - - | - - - - | 8.54 8.54 - - | 08/31/2020 |
| MOEAX | NYLI Growth ETF Allocation Fund | Multi-Asset | A |
|
Global Moderately Aggressive Allocation | 172 | 4.51 4.51 1.38 1.38 | 16.99 16.99 13.48 13.48 | 12.56 12.56 11.42 11.42 | 6.99 6.99 6.34 6.34 | - - - - | 10.13 10.13 9.55 9.55 | 06/30/2020 |
| MHYCX | NYLI Candriam Emerging Markets Debt Fund | Fixed Income | C |
|
Emerging Markets Bond | 203 | 0.79 0.79 -0.21 -0.21 | 7.09 7.09 6.09 6.09 | 8.51 8.51 8.51 8.51 | 0.82 0.82 0.82 0.82 | 2.36 2.36 2.36 2.36 | 6.72 6.72 6.72 6.72 | 09/01/1998 |
| MGHAX | NYLI Candriam Emerging Markets Debt Fund | Fixed Income | A |
|
Emerging Markets Bond | 203 | 1.07 1.07 -3.48 -3.48 | 8.05 8.05 3.18 3.18 | 9.72 9.72 8.05 8.05 | 1.96 1.96 1.03 1.03 | 3.47 3.47 2.99 2.99 | 6.39 6.39 6.22 6.22 | 06/01/1998 |
| MGHHX | NYLI Candriam Emerging Markets Debt Fund | Fixed Income | IN |
|
Emerging Markets Bond | 203 | 0.93 0.93 -3.11 -3.11 | 7.84 7.84 3.52 3.52 | 9.29 9.29 7.81 7.81 | 1.57 1.57 0.75 0.75 | 3.12 3.12 2.65 2.65 | 4.10 4.10 3.83 3.83 | 02/28/2008 |
| MGHIX | NYLI Candriam Emerging Markets Debt Fund | Fixed Income | I |
|
Emerging Markets Bond | 203 | 1.20 1.20 - - | 8.55 8.55 - - | 10.10 10.10 - - | 2.30 2.30 - - | 3.78 3.78 - - | 4.79 4.79 - - | 08/31/2007 |
| MMIN | NYLI MacKay Muni Insured ETF | Fixed Income | - |
|
Muni National Long | 152 | 1.35 1.35 1.45 1.45 | 5.10 5.10 5.13 5.13 | 3.16 3.16 3.11 3.11 | 0.64 0.64 0.63 0.63 | - - - - | 2.45 2.45 2.45 2.45 | 10/18/2017 |
| MMIOX | NYLI MacKay Muni Income Opportunities Fund | Fixed Income | I | - | Muni National Long | 152 | 1.80 1.80 - - | 5.35 5.35 - - | - - - - | - - - - | - - - - | 4.26 4.26 - - | 03/25/2024 |
| MMIPX | NYLI MacKay Muni Income Opportunities Fund | Fixed Income | A1 | - | Muni National Long | 152 | 1.65 1.65 -1.40 -1.40 | 4.83 4.83 1.69 1.69 | - - - - | - - - - | - - - - | 3.74 3.74 2.19 2.19 | 03/25/2024 |
| MMIRX | NYLI MacKay Muni Income Opportunities Fund | Fixed Income | A2 | - | Muni National Long | 152 | 1.65 1.65 - - | 4.72 4.72 - - | - - - - | - - - - | - - - - | 3.74 3.74 - - | 03/25/2024 |
| MMIVX | NYLI MacKay Muni Income Opportunities Fund | Fixed Income | A3 | - | Muni National Long | 152 | 1.58 1.58 - - | 4.57 4.57 - - | - - - - | - - - - | - - - - | 3.49 3.49 - - | 03/25/2024 |
| ORTFX | NYLI MacKay Oregon Muni Fund | Fixed Income | Z |
|
Muni Single State Intermediate | 105 | 0.79 0.79 -2.24 -2.24 | 4.32 4.32 1.19 1.19 | 1.97 1.97 0.94 0.94 | 0.34 0.34 -0.27 -0.27 | 1.15 1.15 0.84 0.84 | 4.35 4.35 4.27 4.27 | 06/16/1986 |
| ORTYX | NYLI MacKay Oregon Muni Fund | Fixed Income | I |
|
Muni Single State Intermediate | 105 | 0.93 0.93 - - | 4.59 4.59 - - | 2.16 2.16 - - | 0.51 0.51 - - | 1.31 1.31 - - | 3.60 3.60 - - | 04/05/1996 |
| ORTCX | NYLI MacKay Oregon Muni Fund | Fixed Income | C |
|
Muni Single State Intermediate | 105 | 0.68 0.68 -0.32 -0.32 | 4.02 4.02 3.02 3.02 | 1.43 1.43 1.43 1.43 | -0.33 -0.33 -0.33 -0.33 | 0.38 0.38 0.38 0.38 | 2.60 2.60 2.60 2.60 | 04/05/1996 |
| ORTBX | NYLI MacKay Oregon Muni Fund | Fixed Income | A | - | Muni Single State Intermediate | 105 | 0.86 0.86 -2.17 -2.17 | 4.22 4.22 1.09 1.09 | - - - - | - - - - | - - - - | 2.52 2.52 0.70 0.70 | 07/22/2024 |
| VREQX | NYLI CBRE Real Estate Fund | Equities | R6 |
|
Real Estate | 197 | 11.84 11.84 - - | 2.85 2.85 - - | 5.23 5.23 - - | 3.77 3.77 - - | 4.43 4.43 - - | 5.38 5.38 - - | 07/03/2014 |
| CRARX | NYLI CBRE Real Estate Fund | Equities | I |
|
Real Estate | 197 | 11.81 11.81 - - | 2.75 2.75 - - | 5.14 5.14 - - | 3.68 3.68 - - | 4.35 4.35 - - | 8.38 8.38 - - | 12/31/1996 |
| CRCRX | NYLI CBRE Real Estate Fund | Equities | C |
|
Real Estate | 197 | 11.43 11.43 10.43 10.43 | 1.70 1.70 0.70 0.70 | 4.01 4.01 4.01 4.01 | 2.56 2.56 2.56 2.56 | 3.21 3.21 3.21 3.21 | 7.80 7.80 7.80 7.80 | 01/17/2003 |
| CRVRX | NYLI CBRE Real Estate Fund | Equities | IN |
|
Real Estate | 197 | 11.71 11.71 6.13 6.13 | 2.41 2.41 -2.71 -2.71 | 4.72 4.72 2.94 2.94 | 3.28 3.28 2.23 2.23 | - - - - | 2.16 2.16 1.21 1.21 | 02/24/2020 |
| CLARX | NYLI CBRE Real Estate Fund | Equities | A |
|
Real Estate | 197 | 11.54 11.54 5.41 5.41 | 2.42 2.42 -3.21 -3.21 | 4.77 4.77 2.81 2.81 | 3.31 3.31 2.15 2.15 | 3.98 3.98 3.37 3.37 | 8.52 8.52 8.25 8.25 | 12/20/2002 |
| MNA | NYLI Merger Arbitrage ETF | Alternatives | - |
|
Event Driven | 42 | 1.29 1.29 1.40 1.40 | 6.56 6.56 5.91 5.91 | 5.25 5.25 5.16 5.16 | 2.27 2.27 2.21 2.21 | 2.76 2.76 2.72 2.72 | 2.77 2.77 2.76 2.76 | 11/17/2009 |
| COTAX | NYLI MacKay Colorado Muni Fund | Fixed Income | A | - | Muni Single State Intermediate | 105 | 0.92 0.92 -2.11 -2.11 | 4.11 4.11 0.99 0.99 | - - - - | - - - - | - - - - | 2.55 2.55 0.72 0.72 | 07/22/2024 |
| COTCX | NYLI MacKay Colorado Muni Fund | Fixed Income | C |
|
Muni Single State Intermediate | 105 | 0.84 0.84 -0.16 -0.16 | 3.82 3.82 2.82 2.82 | 1.52 1.52 1.52 1.52 | -0.30 -0.30 -0.30 -0.30 | 0.32 0.32 0.32 0.32 | 2.35 2.35 2.35 2.35 | 04/30/1996 |
| COTYX | NYLI MacKay Colorado Muni Fund | Fixed Income | I |
|
Muni Single State Intermediate | 105 | 0.99 0.99 - - | 4.37 4.37 - - | 2.27 2.27 - - | 0.57 0.57 - - | 1.24 1.24 - - | 3.42 3.42 - - | 04/30/1996 |
| COTFX | NYLI MacKay Colorado Muni Fund | Fixed Income | Z |
|
Muni Single State Intermediate | 105 | 1.06 1.06 -1.97 -1.97 | 4.26 4.26 1.14 1.14 | 2.21 2.21 1.18 1.18 | 0.49 0.49 -0.12 -0.12 | 1.18 1.18 0.88 0.88 | 4.20 4.20 4.12 4.12 | 05/21/1987 |
| MCCVX | NYLI MacKay Convertible Fund | Multi-Asset | C |
|
Convertibles | 74 | 10.09 10.09 9.09 9.09 | 21.05 21.05 20.05 20.05 | 10.34 10.34 10.34 10.34 | 4.71 4.71 4.71 4.71 | 9.49 9.49 9.49 9.49 | 7.62 7.62 7.62 7.62 | 09/01/1998 |
| MCOAX | NYLI MacKay Convertible Fund | Multi-Asset | A |
|
Convertibles | 74 | 10.40 10.40 4.33 4.33 | 22.25 22.25 15.53 15.53 | 11.45 11.45 9.37 9.37 | 5.73 5.73 4.54 4.54 | 10.53 10.53 9.91 9.91 | 8.86 8.86 8.66 8.66 | 01/03/1995 |
| MCINX | NYLI MacKay Convertible Fund | Multi-Asset | IN |
|
Convertibles | 74 | 10.27 10.27 4.76 4.76 | 21.94 21.94 15.85 15.85 | 11.18 11.18 9.29 9.29 | 5.50 5.50 4.42 4.42 | 10.31 10.31 9.69 9.69 | 8.15 8.15 7.81 7.81 | 02/28/2008 |
| MCNVX | NYLI MacKay Convertible Fund | Multi-Asset | I |
|
Convertibles | 74 | 10.45 10.45 - - | 22.62 22.62 - - | 11.79 11.79 - - | 6.06 6.06 - - | 10.90 10.90 - - | 11.85 11.85 - - | 11/28/2008 |
| MMIT | NYLI MacKay Muni Intermediate ETF | Fixed Income | - |
|
Muni National Intermediate | 255 | 0.90 0.90 0.88 0.88 | 4.55 4.55 4.57 4.57 | 3.13 3.13 3.15 3.15 | 1.09 1.09 1.11 1.11 | - - - - | 2.60 2.60 2.61 2.61 | 10/18/2017 |
| MGOCX | NYLI WMC Enduring Capital Fund | Equities | C |
|
Large Blend | 1212 | 1.58 1.58 0.58 0.58 | -7.97 -7.97 -8.85 -8.85 | 6.35 6.35 6.35 6.35 | 5.11 5.11 5.11 5.11 | 9.06 9.06 9.06 9.06 | 6.26 6.26 6.26 6.26 | 09/01/1998 |
| MSOAX | NYLI WMC Enduring Capital Fund | Equities | A |
|
Large Blend | 1212 | 1.90 1.90 -3.70 -3.70 | -7.00 -7.00 -12.11 -12.11 | 7.42 7.42 5.42 5.42 | 6.15 6.15 4.95 4.95 | 10.16 10.16 9.54 9.54 | 6.92 6.92 6.70 6.70 | 06/01/1998 |
| MCSSX | NYLI WMC Enduring Capital Fund | Equities | IN |
|
Large Blend | 1212 | 1.82 1.82 -3.27 -3.27 | -7.24 -7.24 -11.88 -11.88 | 7.16 7.16 5.34 5.34 | 5.91 5.91 4.83 4.83 | 9.89 9.89 9.27 9.27 | 8.07 8.07 7.73 7.73 | 02/28/2008 |
| MSOIX | NYLI WMC Enduring Capital Fund | Equities | I |
|
Large Blend | 1212 | 1.97 1.97 - - | -6.77 -6.77 - - | 7.69 7.69 - - | 6.41 6.41 - - | 10.44 10.44 - - | 8.38 8.38 - - | 12/28/2004 |
| MCSDX | NYLI WMC Enduring Capital Fund | Equities | R6 |
|
Large Blend | 1212 | 2.00 2.00 - - | -6.73 -6.73 - - | 7.76 7.76 - - | - - - - | - - - - | 5.41 5.41 - - | 04/26/2021 |
| MSPIX | NYLI S&P 500 Index Fund | Equities | I |
|
Large Blend | 1212 | 2.04 2.04 - - | 17.49 17.49 - - | 18.00 18.00 - - | 11.77 11.77 - - | 13.85 13.85 - - | 10.69 10.69 - - | 01/02/1991 |
| MSXAX | NYLI S&P 500 Index Fund | Equities | A |
|
Large Blend | 1212 | 1.98 1.98 0.45 0.45 | 17.20 17.20 15.44 15.44 | 17.70 17.70 17.11 17.11 | 11.49 11.49 11.15 11.15 | 13.57 13.57 13.23 13.23 | 9.76 9.76 9.61 9.61 | 01/02/2004 |
| MYSPX | NYLI S&P 500 Index Fund | Equities | IN |
|
Large Blend | 1212 | 1.93 1.93 0.91 0.91 | 16.97 16.97 15.80 15.80 | 17.48 17.48 17.08 17.08 | 11.28 11.28 11.06 11.06 | 13.38 13.38 13.04 13.04 | 10.41 10.41 10.22 10.22 | 02/28/2008 |
| MSXMX | NYLI S&P 500 Index Fund | Equities | SI |
|
Large Blend | 1212 | 1.91 1.91 - - | 16.93 16.93 - - | 17.43 17.43 - - | 11.14 11.14 - - | - - - - | 12.51 12.51 - - | 08/31/2020 |
| MGVCX | NYLI MacKay U.S. Infrastructure Bond Fund | Fixed Income | C |
|
Intermediate Core Bond | 417 | 0.67 0.67 -0.32 -0.32 | 4.49 4.49 3.49 3.49 | 3.57 3.57 3.57 3.57 | 0.07 0.07 0.07 0.07 | 0.80 0.80 0.80 0.80 | 2.29 2.29 2.29 2.29 | 09/01/1998 |
| MGVAX | NYLI MacKay U.S. Infrastructure Bond Fund | Fixed Income | A |
|
Intermediate Core Bond | 417 | 0.83 0.83 -2.20 -2.20 | 5.41 5.41 2.25 2.25 | 4.58 4.58 3.53 3.53 | 1.10 1.10 0.18 0.18 | 1.85 1.85 1.38 1.38 | 3.89 3.89 3.73 3.73 | 01/03/1995 |
| MGVNX | NYLI MacKay U.S. Infrastructure Bond Fund | Fixed Income | IN |
|
Intermediate Core Bond | 417 | 0.88 0.88 -1.64 -1.64 | 5.24 5.24 2.61 2.61 | 4.33 4.33 3.45 3.45 | 0.81 0.81 -0.01 -0.01 | 1.55 1.55 1.08 1.08 | 2.23 2.23 1.97 1.97 | 02/28/2008 |
| MGOIX | NYLI MacKay U.S. Infrastructure Bond Fund | Fixed Income | I |
|
Intermediate Core Bond | 417 | 1.02 1.02 - - | 5.74 5.74 - - | 4.83 4.83 - - | 1.31 1.31 - - | 2.08 2.08 - - | 3.04 3.04 - - | 01/02/2004 |
| MGVDX | NYLI MacKay U.S. Infrastructure Bond Fund | Fixed Income | R6 |
|
Intermediate Core Bond | 417 | 0.92 0.92 - - | 5.83 5.83 - - | 4.86 4.86 - - | 1.38 1.38 - - | - - - - | 1.72 1.72 - - | 11/01/2019 |
| IQRA | NYLI CBRE Real Assets ETF | Equities | - | - | Global Real Estate | 152 | 8.94 8.94 9.01 9.01 | 12.97 12.97 13.53 13.53 | - - - - | - - - - | - - - - | 8.71 8.71 9.01 9.01 | 05/10/2023 |
| WRND | NYLI Global Equity R&D Leaders ETF | Equities | - |
|
Global Large-Stock Growth | 299 | 6.25 6.25 6.65 6.65 | 21.63 21.63 23.05 23.05 | 17.28 17.28 17.80 17.80 | - - - - | - - - - | 10.64 10.64 11.01 11.01 | 02/08/2022 |
| MIXIX | NYLI Short Term Bond Fund | Fixed Income | I |
|
Short-Term Bond | 525 | 0.66 0.66 - - | 3.72 3.72 - - | 4.69 4.69 - - | 2.10 2.10 - - | 2.40 2.40 - - | 4.80 4.80 - - | 01/02/1991 |
| MIXAX | NYLI Short Term Bond Fund | Fixed Income | A |
|
Short-Term Bond | 525 | 0.46 0.46 -0.54 -0.54 | 3.37 3.37 2.33 2.33 | 4.34 4.34 4.00 4.00 | 1.75 1.75 1.55 1.55 | 2.08 2.08 1.77 1.77 | 3.06 3.06 2.92 2.92 | 01/02/2004 |
| MIXNX | NYLI Short Term Bond Fund | Fixed Income | IN |
|
Short-Term Bond | 525 | 0.42 0.42 -0.09 -0.09 | 3.15 3.15 2.64 2.64 | 4.11 4.11 3.94 3.94 | 1.56 1.56 1.46 1.46 | 1.87 1.87 1.56 1.56 | 2.67 2.67 2.49 2.49 | 02/28/2008 |
| MIXMX | NYLI Short Term Bond Fund | Fixed Income | SI |
|
Short-Term Bond | 525 | 0.40 0.40 - - | 3.21 3.21 - - | 4.06 4.06 - - | 1.42 1.42 - - | - - - - | 1.34 1.34 - - | 08/31/2020 |
| VCRQX | NYLI CBRE Global Infrastructure Fund | Equities | R6 |
|
Infrastructure | 82 | 11.48 11.48 - - | 18.70 18.70 - - | 11.19 11.19 - - | 8.04 8.04 - - | - - - - | 6.56 6.56 - - | 02/24/2020 |
| VCRIX | NYLI CBRE Global Infrastructure Fund | Equities | I |
|
Infrastructure | 82 | 11.46 11.46 - - | 18.61 18.61 - - | 11.12 11.12 - - | 7.96 7.96 - - | 8.64 8.64 - - | 8.99 8.99 - - | 06/28/2013 |
| VCRCX | NYLI CBRE Global Infrastructure Fund | Equities | C |
|
Infrastructure | 82 | 11.09 11.09 10.09 10.09 | 17.27 17.27 16.27 16.27 | 9.92 9.92 9.92 9.92 | 6.80 6.80 6.80 6.80 | - - - - | 7.27 7.27 7.27 7.27 | 02/28/2019 |
| VCRVX | NYLI CBRE Global Infrastructure Fund | Equities | IN |
|
Infrastructure | 82 | 11.39 11.39 5.82 5.82 | 18.16 18.16 12.25 12.25 | 10.73 10.73 8.86 8.86 | 7.58 7.58 6.49 6.49 | - - - - | 6.11 6.11 5.13 5.13 | 02/24/2020 |
| VCRAX | NYLI CBRE Global Infrastructure Fund | Equities | A |
|
Infrastructure | 82 | 11.31 11.31 5.19 5.19 | 18.27 18.27 11.77 11.77 | 10.80 10.80 8.73 8.73 | 7.65 7.65 6.44 6.44 | 8.33 8.33 7.69 7.69 | 8.26 8.26 7.74 7.74 | 10/16/2013 |
| KLGIX | NYLI WMC Growth Fund | Equities | I |
|
Large Growth | 998 | -3.11 -3.11 - - | 15.65 15.65 - - | 17.43 17.43 - - | 7.31 7.31 - - | 12.64 12.64 - - | 11.71 11.71 - - | 11/02/2009 |
| KLGCX | NYLI WMC Growth Fund | Equities | C |
|
Large Growth | 998 | -3.48 -3.48 -4.45 -4.45 | 14.12 14.12 13.12 13.12 | 15.88 15.88 15.88 15.88 | 5.89 5.89 5.89 5.89 | 11.19 11.19 11.19 11.19 | 9.97 9.97 9.97 9.97 | 01/18/2013 |
| KLGAX | NYLI WMC Growth Fund | Equities | A |
|
Large Growth | 998 | -3.19 -3.19 -8.51 -8.51 | 15.33 15.33 8.98 8.98 | 17.10 17.10 14.91 14.91 | 6.99 6.99 5.79 5.79 | 12.35 12.35 11.71 11.71 | 9.40 9.40 9.08 9.08 | 08/07/2006 |
| KLGNX | NYLI WMC Growth Fund | Equities | IN |
|
Large Growth | 998 | -3.28 -3.28 -8.11 -8.11 | 15.02 15.02 9.26 9.26 | 16.77 16.77 14.79 14.79 | 6.69 6.69 5.60 5.60 | 12.04 12.04 11.41 11.41 | 10.80 10.80 10.33 10.33 | 01/18/2013 |
| KLGDX | NYLI WMC Growth Fund | Equities | R6 |
|
Large Growth | 998 | -3.10 -3.10 - - | 15.68 15.68 - - | 17.45 17.45 - - | - - - - | - - - - | 5.73 5.73 - - | 04/26/2021 |
Performance data quoted represents past performance. Past performance is no guarantee of future results. Due to market volatility, current performance may be less or higher than the figures shown. Investment return and principal value will fluctuate so that upon redemption, shares may be worth more or less than their original cost. Performance figures for all Funds reflect contractual waivers and/or expense limitations, without which total returns may have been lower. These limitations may be modified or terminated only with Board approval.
Click on the product name for the most recent overall risk-adjusted Morningstar ratings shown above, including ratings by share class and time period and the number of funds in each category. The Fund page also includes the prospectus, investment objectives, performance, risk and other important information.
The Morningstar Rating™ for funds, or "star rating", is calculated for managed products (including mutual funds, variable annuity and variable life subaccounts, exchange-traded funds, closed-end funds, and separate accounts) with at least a three-year history. Exchange-traded funds and open-ended mutual funds are considered a single population for comparative purposes. It is calculated based on a Morningstar Risk-Adjusted Return measure that accounts for variation in a managed product's monthly excess performance, placing more emphasis on downward variations and rewarding consistent performance (this does not include the effects of sales charges, loads, and redemption fees). The top 10% of products in each product category receive 5stars, the next 22.5% receive 4 stars, the next 35% receive 3 stars, the next 22.5% receive 2 stars, and the bottom 10% receive 1 star. The Overall Morningstar Rating for a managed product is derived from a weighted average of the performance figures associated with its three-, five-, and 10-year (if applicable) Morningstar Rating metrics. The weights are: 100% three-year rating for 36-59 months of total returns, 60% five-year rating/40% three-year rating for 60-119 months of total returns, and 50% 10-year rating/30% five-year rating/20% three-year rating for 120 or more months of total returns. While the 10-year overall star rating formula seems to give the most weight to the 10-year period, the most recent three-year period actually has the greatest impact because it is included in all three rating periods.
National and State-specific Strategies Across the Income and Risk Spectrum
This is a hypothetical illustration showing relative potential risk and yield. Risk based on standard deviation. *National muni tax-equivalent yield based on 40.80% tax level (37% highest federal tax bracket plus the 3.8% Medicare surcharge). CA and NY muni tax equivalent yield based on the blended rates derived from a top federal income tax rate of 37%, the 3.8% Medicare tax, top state income tax rates of 8.82% and 13.30% in New York and California, respectively. Past performance is no guarantee of future results, which will vary. All mutual funds are subject to market risk and will fluctuate in value. Corporate High Yield Bonds index is represented by the Bloomberg Barclays High-Yield Corporate Bond Index. The U.S. Corporate bond index is represented by the Bloomberg Barclays U.S. Corporate Bond Index. The U.S. Treasury index is represented by the Bloomberg Barclays U.S. 1-3 Year Government/Credit Index. The U.S. Aggregate bond index is represented by the Bloomberg Barclays U.S. Aggregate Bond Index.
Historical Insights
Historical Insights
Historical Insights
2025 Municipal Market Outlook

2024 Municipal Market Outlook

2023 Municipal Bond Market Insights


2021 Municipal Bond Market Insights

2020 Municipal Bond Market Insights

2019 Municipal Bond Market Insights

2018 Municipal Bond Market Insights

2017 Municipal Bond Market Insights

2016 Municipal Bond Market Insights

2015 Municipal Bond Market Insights

2014 Municipal Bond Market Insights

2013 Municipal Bond Market Insights

2012 Municipal Bond Market Insights

2011 Municipal Bond Market Insights
The Morningstar Medalist RatingTM is the summary expression of Morningstar’s forward-looking analysis of investment strategies as offered via specific vehicles using a rating scale of Gold, Silver, Bronze, Neutral, and Negative. The Medalist Ratings indicate which investments Morningstar believes are likely to outperform a relevant index or peer group average on a risk-adjusted basis over time. Investment products are evaluated on three key pillars (People, Parent, and Process) which, when coupled with a fee assessment, forms the basis for Morningstar’s conviction in those products’ investment merits and determines the Medalist Rating they’re assigned. Pillar ratings take the form of Low, Below Average, Average, Above Average, and High. Pillars may be evaluated via an analyst’s qualitative assessment (either directly to a vehicle the analyst covers or indirectly when the pillar ratings of a covered vehicle are mapped to a related uncovered vehicle) or using algorithmic techniques. Vehicles are sorted by their expected performance into rating groups defined by their Morningstar Category and their active or passive status. When analysts directly cover a vehicle, they assign the three pillar ratings based on their qualitative assessment, subject to the oversight of the Analyst Rating Committee, and monitor and reevaluate them at least every 14 months. When the vehicles are covered either indirectly by analysts or by algorithm, the ratings are assigned monthly. For more detailed information about these ratings, including their methodology, please go to global.morningstar.com/managerdisclosures/.
The Morningstar Medalist Rating (i) should not be used as the sole basis in evaluating an investment product, (ii) involves unknown risks and uncertainties which may cause expectations not to occur or to differ significantly from what was expected, (iii) are not guaranteed to be based on complete or accurate assumptions or models when determined algorithmically, (iv) involve the risk that the return target will not be met due to such things as unforeseen changes in management, technology, economic development, interest rate development, operating and/or material costs, competitive pressure, supervisory law, exchange rate, tax rates, exchange rate changes, and/or changes in political and social conditions, and (v) should not be considered an offer or solicitation to buy or sell the investment product. A change in the fundamental factors underlying the Morningstar Medalist Rating can mean that the rating is subsequently no longer accurate.
© 2024 Morningstar, Inc. All rights reserved. The information contained herein: (1) is proprietary to Morningstar and/or its content providers; (2) may not be copied or distributed; and (3) is not warranted to be accurate, complete, or timely. Neither Morningstar nor its content providers are responsible for any damages or losses arising from any use of this information. Past performance is no guarantee of future results.
Bloomberg High-Yield Corporate Bond Index is a rules-based, market-value-weighted index engineered to measure publicly issued non-investment grade USD fixed-rate, taxable and corporate bonds. Bloomberg U.S. Corporate Bond Index measures the investment grade, fixed-rate, taxable corporate bond market. It includes USD denominated securities publicly issued by U.S. and non-U.S. industrial, utility and financial issuers. Bloomberg U.S. 1-3 Year Government/Credit Index includes investment-grade corporate debt issues as well as debt issues of U.S. government agencies and the U.S. Treasury, with maturities of one to three years. Index results assume the reinvestment of all capital gain and dividend distributions. Bloomberg U.S. Aggregate Bond Index is a broad-based benchmark that measures the investment-grade, U.S. dollar-denominated, fixed-rate taxable bond market, including Treasuries, government-related and corporate securities, mortgage-backed securities (agency fixed-rate and hybrid adjustable-rate mortgage pass-throughs), asset-backed securities, and commercial mortgage-backed securities.
Active management is the use of a human element, such as a single manager, co-managers or a team of managers, to actively manage a fund’s portfolio. Active management strategies typically have higher fees than passive management.
Please note that not all products may be available for sale to all registered representatives and agents. Please consult your firm guidelines. Please note that not all products may be available for sale to all registered representatives and agents. Please consult your firm guidelines.