
A Structural Break in Portfolio Construction
For most of the past three decades, global fixed income portfolios have been constructed around a relatively stable framework: developed-market government bonds as the primary risk anchor, developed-market credit as the core income engine, and emerging market debt as a satellite allocation. We believe that framework is now being challenged at its foundations.
The shift is not cyclical. It reflects a structural divergence in fiscal dynamics, economic capacity and capital deployment. Across developed markets, persistent deficits, rising debt burdens and reduced policy flexibility are gradually eroding the reliability of traditional portfolio anchors. At the same time, capital is being redirected by forces largely independent of financial markets: energy transition, supply chain reconfiguration and technological competition. These forces are not evenly distributed. They are disproportionately concentrated in emerging markets, where investment is being deployed into infrastructure build-out, industrial capacity expansion, and resource extraction at scale. The consequence is a gradual but meaningful redistribution of economic relevance.
What has changed is not simply the opportunity set, but the underlying system in which portfolios operate. In a multipolar environment, the assumption that fixed income can be anchored predominantly in developed markets is increasingly difficult to justify.
A Market That Has Already Adjusted
Within this shifting landscape, emerging market corporate debt has undergone a transformation that is still underappreciated (figure 1). The asset class now exceeds USD 2.6 trillion and encompasses more than 700 issuers across 65 countries (source: JP Morgan). However, the defining feature of this evolution is not its scale, it is the improvement in credit quality and financial discipline that has accompanied its growth.
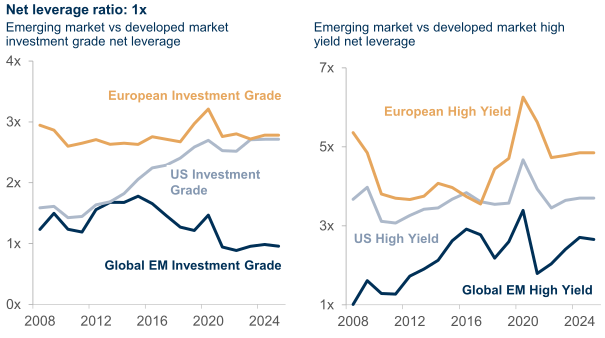
Leverage across both investment-grade and high-yield segments remains contained relative to developed-market peers. Maturity profiles have extended, funding sources have diversified and refinancing risk have declined. These are not incremental improvements, but a structural evolution in how EM corporates manage their balance sheets and access capital markets.
Default cycles corroborate this shift. Recent periods of below-average default rates in EM are less indicative of benign conditions than of greater issuer resilience and discipline (source: JP Morgan).
Yet valuation has not fully adjusted. Spreads continue to embed a persistent geographic premium. Even when controlling for rating and maturity, EM corporates typically offer excess yield relative to developed-market equivalents.
The implication is not merely that value exists in EM, but that the repricing of EM credit risk remains incomplete.
Figure 1: From Niche to Core: The Structural Expansion of EM Corporate Credit
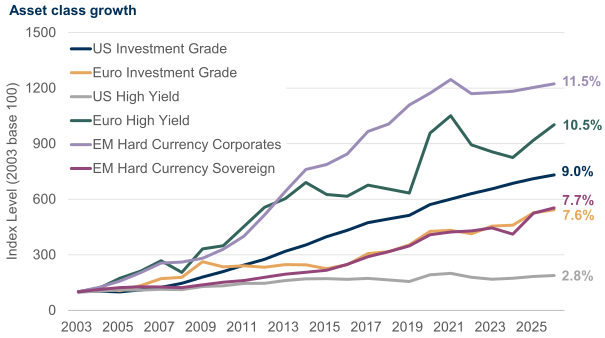
Data as of June 30, 2026. EM Hard Currency Corporates = The JPM Corporate Emerging Market Broad Index; EM Hard Currency Sovereign = The JPM Emerging Markets Bond Index; Euro High Yield = Bloomberg Pan-European High Yield (Euro) Index Value Unhedged USD; Euro Investment Grade = Bloomberg Pan European Aggregate Corporate Total Return Index Value Unhedged USD; US Investment Grade = The Bloomberg US Corporate Bond Index; US High Yield = The Bloomberg US Corporate High Yield Bond Index. See disclosures for index descriptions. Source: J.P. Morgan, Bloomberg.
The Persistence of a Perception Premium
The structural case for EM credit increasingly rests on a disconnect between fundamentals and perception.
Historically, EM credit carried a premium for weaker institutions, higher macroeconomic volatility and less developed capital markets. While dispersion remains, many of these structural constraints have moderated. Policy frameworks have strengthened, inflation targeting has improved and corporate governance has advanced (figures 2 and 4).
At the same time, developed-market credit has moved in the opposite direction: higher leverage, tighter spreads and reduced compensation for risk. The result is a misalignment. Investors are still often paid for geographic association rather than for actual credit risk.
For institutional allocators, this reframes the debate. The question is no longer whether EM is riskier. It is whether risk is being assessed and priced correctly across regions.
Multiple Engines of Return
A defining strength of emerging market debt is its internal breadth and diversity. Local-currency sovereigns are driven by domestic policy cycles and currency dynamics. Hard-currency sovereigns reflect external balance sheet and credit conditions that, in many cases, are further advanced in adjustment and repair. EM corporates offer exposure to a wide range of industries, across multiple geographies with differing economic cycles, and broadly benefit from solid bottom-up fundamentals including strong balance sheets and capital discipline.
These are not overlapping expressions of the same macro view. They are distinct sources of return, with different sensitivities to rates, inflation, economic growth and global liquidity conditions. In a multipolar system, where macro cycles are less synchronized, this internal diversification is not incidental. It is a structural and valuable advantage.
Against this backdrop, it is our view that EM corporates increasingly represent an essential core allocation, rather than an opportunistic trade. They combine, in most cases, strong fundamentals with a persistent spread premium, while providing exposure to sectors directly linked to long duration global capital deployment: energy infrastructure, natural resources, telecommunications and logistics. These sectors are not cyclical overlays; they are central to the current investment cycle, which increasingly resembles a heavy industrial cycle. In many cases, EM corporates are the entities executing the physical build-out of global economic transformation.
Figure 2: Yield vs Credit Quality Across Global Fixed Income
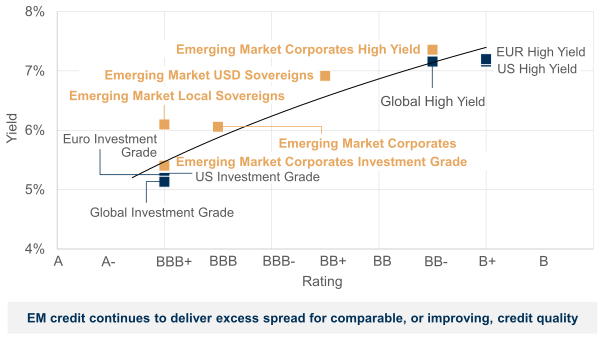
Data as of June 30, 2026. Emerging Market Corporates = J.P. Morgan CEMBI Diversified Broad Index; Emerging Market Corporates High Yield = J.P. Morgan CEMBI Broad Diversified High Yield Index; Emerging Market Corporates Investment Grade = J.P. Morgan CEMBI Broad Diversified High Grade Index; Emerging Market Local Sovereigns = J.P. Morgan GBI-EM Global Diversified Index; Emerging Market USD Sovereigns = J.P. Morgan EMBI Global Diversified Index; EUR High Yield = ICE BofA Euro High Yield Index; Euro Investment Grade = ICE Bank of America Euro Investment Grade Index; Global Investment Grade = ICE Bank of America Global Investment Grade Index; Global Broad Markets Bonds = ICE BofA Global Broad Market Index; Global High Yield = ICE BofA Global High Yield Index; US Investment Grade = ICE Bank of America US Investment Grade Index; US High Yield = ICE BofA US High Yield Index;
Source: Bloomberg.
The Euro Dimension: A New Axis of Diversification
If the multipolar system is reshaping where credit quality resides, it is also reshaping the currencies in which that opportunity is expressed. For most of its history, hard-currency emerging market debt has been effectively synonymous with US dollar issuance — an equivalence that is now breaking down. Over the past decade, the euro-denominated segment has evolved from a marginal corner of external issuance into a meaningful, and increasingly distinct, asset class.
The shift became difficult to ignore in 2025, when euro-denominated issuance reached approximately USD 123 billion, up around 80% year-on-year, lifting its share of total EM hard-currency supply to close to 20%, a historic high (source: BofA research June 2026). This largely sovereign-led expansion reflects a convergence of structural forces rather than a cyclical quirk: sustained demand for non-dollar exposure, alongside issuer incentives such as lower funding costs and improved liability management through reduced currency volatility.
For allocators, this introduces a genuinely differentiated opportunity set. Euro EM debt typically carries higher average credit quality, generally centred on investment-grade ratings and has delivered attractive long-term risk-adjusted returns relative to broader hard-currency benchmarks. It therefore offers access to emerging market return premia while preserving a more defensive credit profile, a particularly relevant consideration for capital-constrained and insurance-based investors. It also diversifies portfolios on two axes at once, currency and underlying risk, at a time when US dollar concentration remains a consequential and under-examined risk. In our view, the universe is now broad enough to support this on its own merits, spanning more than 40 sovereigns and over 80 corporate issuers, while typically exhibiting lower ESG risk than the broader EM market.
We believe the income case is equally compelling: euro-based investors can currently achieve yields in the region of 5%, a meaningful pick-up over developed markets with lower volatility, while dollar-based investors gain relative value alpha and currency diversification. The segment is deep enough to reward active management across countries, sectors and issuers, though it remains structurally smaller and less liquid than its dollar counterpart, making position sizing, liquidity and FX management central to outcomes. In our view, euro-denominated EM debt is evolving from a peripheral segment into a core allocation.
From Yield Enhancement to Portfolio Efficiency
The case for EM debt is often framed primarily in terms of yield. The more relevant lens is portfolio efficiency. Empirical analysis shows that incorporating EM corporates into global investment-grade portfolios improves return per unit of volatility. Similar benefits are evident within high-yield allocations (figure 3). This improvement is not a function of carry alone. It reflects the interaction of structural spread premium, differentiated economic exposure and lower correlation to developed-market credit cycles.
In practical terms, EM exposure has consistently shifted the efficient frontier outward (figure 2). In an environment characterized by compressed spreads and elevated duration risk, this is not marginal, it is consequential to portfolio construction.
Figure 3: Enhancing the Efficient Frontier with EM Corporate Credit
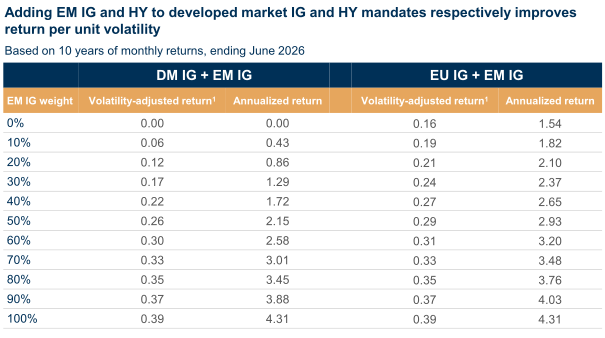
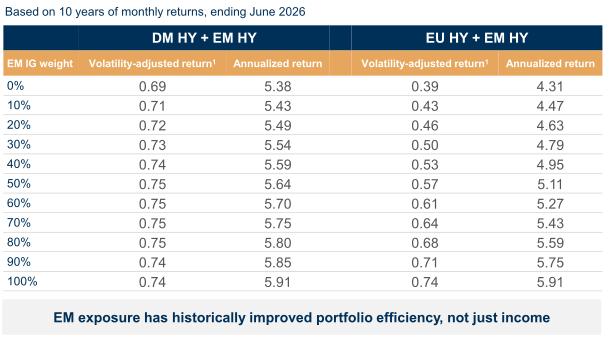
DM IG = Bloomberg Global Aggregate - Developed Markets; EU IG = Bloomberg Pan European Aggregate Corporate Total Return Index Value Unhedged USD; EM IG = The JPM Corporate Emerging Market Broad Diversified Investment Grade Bond Index. Returns are unhedged, expressed in USD.
For illustrative purposes only. Based on BLOOMBERG and JP MORGAN DATA and asset allocation percentages determined by MacKay Shields and/or New York Life Investment Management. The returns shown above do not represent the returns of any client portfolio or strategy actually managed by MacKay Shields and should not be construed as such. The returns shown are index-based and mathematically calculated based on the percentages shown; MacKay Shields’ portfolios are actively managed and would vary from any applicable or benchmarked index. Therefore, the returns shown are not indicative of investment skill. Actual portfolios would be subject to fees and expenses. No fees or expenses were included in the results above. No representation is made as to the accuracy and completeness of information contained in this presentation that has been obtained from third parties.
It is not possible to invest directly in an index. Past performance is not indicative of future results. Please see the disclosures and index descriptions at the end of this presentation.
Data Source: JP Morgan, ICE BofA, Bloomberg.
Balance Sheets: The Underappreciated Shift
One of the more underappreciated developments in global credit is the divergence in balance sheet trajectories. Across EM corporates, leverage remains structurally lower than in many developed-market counterparts. Sovereign balance sheets, while heterogeneous, have also improved following a decade of adjustment, reform and more disciplined fiscal management.
By contrast, developed-market balance sheets have expanded, both at the sovereign and corporate level. This divergence is gradual but persistent, and increasingly relevant for long-term allocators. This divergence challenges the assumption that risk is inherently higher in emerging markets. Increasingly, risk is better understood through balance sheet structure and funding dynamics than through geography alone.
Figure 4: Leverage Discipline: EM vs Developed Market Corporates
Last 12 months ending June 30, 2025.
1 LTM = Last 12 months.
Latest data point, as at end Q2 2025. Asset classes derived from proprietary classifications. Net leverage = (Debt – Cash) / EBITDA.
Source: JP Morgan.
The Allocation Gap
Despite these structural shifts, EM debt remains underrepresented in institutional portfolios. Benchmark compositions have evolved, and EM’s share of global credit markets has increased meaningfully. Yet allocations remain structurally below what would be implied by economic importance, market size, fundamentals and return characteristics. This creates a gap between opportunity and allocation.
Historically, such gaps do not persist indefinitely. As fundamentals are in place, perceptions adjust and capital flows respond, repricing tends to follow. The timing is uncertain, but the direction is increasingly clear.
From Optional to Structural
The reconstruction of global fixed income is already underway. Economic activity, capital formation and balance sheet strength are becoming more broadly distributed, while portfolio allocations remain anchored to legacy structures. The divergence between where risk is priced and where fundamentals are improving is increasingly difficult to ignore.
For fixed income investors, the implication is not tactical. It is structural. Emerging market debt offers a combination that is increasingly scarce in global fixed income: improving credit quality, persistent spread premium and direct exposure to the sectors and regions driving incremental global growth.
The relevant question is no longer whether EM belongs in portfolios. It is whether existing allocations adequately reflect emerging markets’ evolving, structurally embedded role in the global credit system. In a multipolar world, maintaining structural underweights to emerging markets increasingly reflects legacy positioning rather than forward-looking asset allocation—anchored in a world that has already passed, not one that is emerging.
Across sovereign and corporate segments, investment grade and high yield, emerging market debt is no longer a satellite allocation. It is part of the core.
IMPORTANT DISCLOSURE
Availability of this document and products and services provided by MacKay Shields LLC may be limited by applicable laws and regulations in certain jurisdictions and this document is provided only for persons to whom this document and the products and services of MacKay Shields LLC may otherwise lawfully be issued or made available. None of the products and services provided by MacKay Shields LLC are offered to any person in any jurisdiction where such offering would be contrary to local law or regulation. It does not constitute investment advice and should not be construed as an offer to buy securities. The contents of this document have not been reviewed by any regulatory authority in any jurisdiction.
This material contains the opinions of the Emerging Market Debt team of MacKay Shields LLC but not necessarily those of MacKay Shields LLC. The opinions expressed herein are subject to change without notice. This material is distributed for informational purposes only. Forecasts, estimates, and opinions contained herein should not be considered as investment advice or a recommendation of any particular security, strategy or investment product. Information contained herein has been obtained from sources believed to be reliable, but not guaranteed. Any forward-looking statements speak only as of the date they are made and MacKay Shields assumes no duty and does not undertake to update forward-looking statements.
No part of this document may be reproduced in any form, or referred to in any other publication, without express written permission of MacKay Shields LLC. ©2026, MacKay Shields LLC. All Rights Reserved.
Information included herein should not be considered predicative of future transactions or commitments made by MacKay Shields LLC nor as an indication of current or future profitability. There is no assurance investment objectives will be met.
Past performance is not indicative of future results.
RISKS OF INVESTING IN EMERGING MARKETS
Foreign securities are subject to interest rate, currency exchange rate, economic, and political risks. The risks of investing in emerging markets include, but are not limited to, the risks of illiquidity, increased price volatility, smaller market capitalizations, less government regulation, less extensive and less frequent accounting, financial and other reporting requirements, risk of loss resulting from problems in share registration and custody, substantial economic and political disruptions and the nationalization of foreign deposits or assets.
NOTE TO UK AND EUROPEAN AUDIENCE
This document is intended only for the use of professional investors as defined in the Alternative Investment Fund Manager’s Directive and/or the UK Financial Conduct Authority’s Conduct of Business Sourcebook. To the extent this document has been issued in the United Kingdom, it has been issued by NYL Investments UK LLP, 200 Aldersgate Street, London UK EC1A 4HD, which is authorised and regulated by the UK Financial Conduct Authority. To the extent this document has been issued in the EEA, it has been issued by NYL Investments Europe Limited, 77 Sir John Rogerson's Quay, Block C Dublin D02 VK60 Ireland. NYL Investments Europe Limited is authorized and regulated by the Central Bank of Ireland (i) to act as an alternative investment fund manager of alternative investment funds under the Alternative Investment Fund Managers Directive (Directive 2011/61/EU) and (ii) to provide the services of individual portfolio management, investment advice and the receipt and transmission of orders as defined in Regulation 7(4) of the AIFMD Regulations to persons who meet the definition of “professional client” as set out in the MiFID Regulations. It has passported its license in additional countries in the EEA.
This document only describes capabilities of certain affiliates of New York Life Investment Management and/or MacKay Shields LLC. No such affiliates will accept subscriptions in any funds not admitted to marketing in your country or provide services to potential customers in your country, including discretionary asset management services, except where it is licensed to do so or can rely on an applicable exemption.
MacKay Shields LLC is a wholly owned subsidiary of New York Life Investment Management Holdings LLC, which is wholly owned by New York Life Insurance Company. "New York Life Investment Management" is both a service mark, and the common trade name of certain investment advisers affiliated with New York Life Insurance Company. Investments are not guaranteed by New York Life Insurance Company or New York Life Investments.
NOTE TO CANADIAN AUDIENCE
The information in these materials is not an offer to sell securities or a solicitation of an offer to buy securities in any jurisdiction of Canada. In Canada, any offer or sale of securities or the provision of any advisory or investment fund manager services will be made only in accordance with applicable Canadian securities laws. More specifically, any offer or sale of securities will be made in accordance with applicable exemptions to dealer and investment fund manager registration requirements, as well as under an exemption from the requirement to file a prospectus, and any advice given on securities will be made in reliance on applicable exemptions to adviser registration requirements.
NOTE TO JAPANESE AUDIENCE
In Japan, this is issued by New York Life Investment Management Asia Limited (Financial Instruments Business Operator, Kanto Local Finance Bureau (FIBO) No. 2964, Member of the Investment Management Association of Japan and the Type 2 Financial Instruments Firms Association) for institutional investors only. As costs and/or fees to be borne by investors vary depending on circumstances such as products, services, investment period and market conditions, the total amount nor the calculation methods cannot be disclosed in advance. All investments involve risks, including market fluctuation and investors may lose the principal amount invested. Investors should obtain and read the prospectus and/or information set forth in Article 37-3 of the Financial Instruments and Exchange Act carefully before making investment decisions.
SOURCE INFORMATION
“Bloomberg®”, “Bloomberg Indices®”, Bloomberg Fixed Income Indices, Bloomberg Equity Indices and all other Bloomberg indices referenced herein are service marks of Bloomberg Finance L.P. and its affiliates, including Bloomberg Index Services Limited (“BISL”), the administrator of the indices (collectively, “Bloomberg”) and have been licensed for use for certain purposes by MacKay Shields LLC (“MacKay Shields”). Bloomberg is not affiliated with MacKay Shields, and Bloomberg does not approve, endorse, review, or recommend MacKay Shields or any products, funds or services described herein. Bloomberg does not guarantee the timeliness, accurateness, or completeness of any data or information relating to MacKay Shields or any products, funds or services described herein.
Subscribe to get MacKay Shields insights delivered to your inbox.